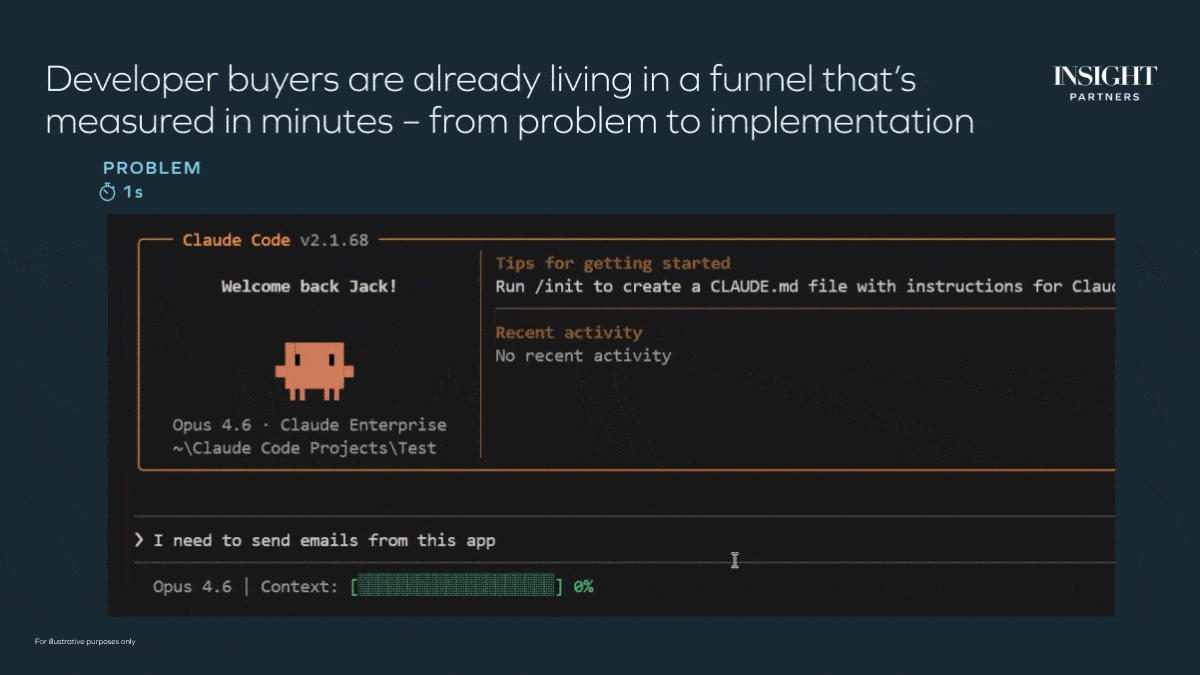
For SaaS businesses, growth is life. In pursuit of life-sustaining capital, SaaS leaders across industry and stage are searching for the secret formula to scale faster and maintain revenue momentum. Resilient businesses raise with ease, can access public markets, become profitable and successfully weather market cycles.
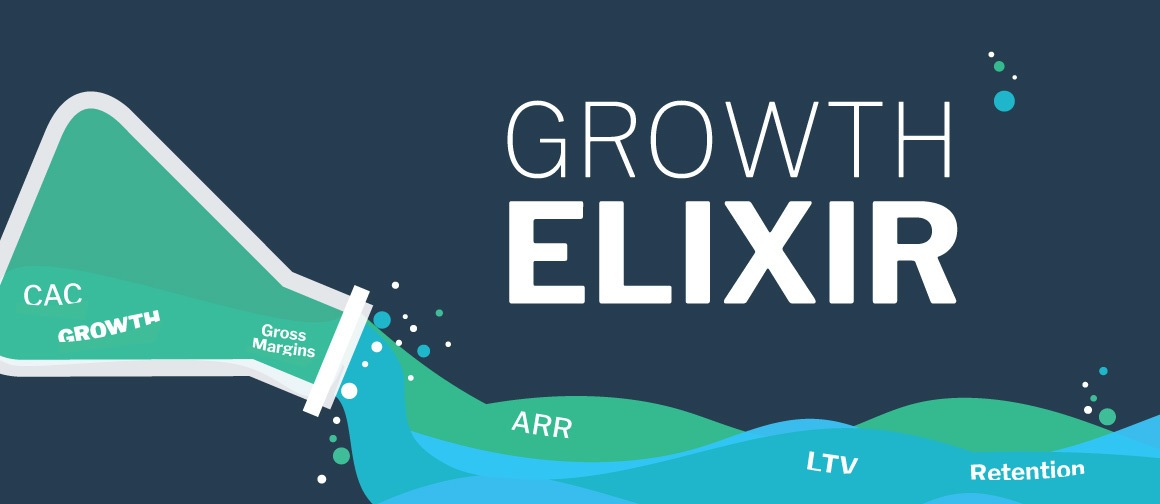
Five years ago, Insight Partners first published the list of ingredients for the elixir of growth: the foundational metrics that measure and monitor the resiliency of a SaaS business.
In this real-data update to Insight’s Periodic Table of SaaS Financial & Operating Metrics, we’ve refreshed our Periodic Table to reflect current market conditions in the dynamic software industry. Our Periodic Table is powered by quarterly performance data across Insight’s portfolio of more than 150 privately-held SaaS investments, as well as 70+ public SaaS companies.
Updating the Periodic Table led us to ask: what has changed, if anything, in the core growth elements of best-in-class software companies?
Our perspective: The SaaS growth elixir is more similar than different, and there is limited evidence of a reformulation.
In private markets, the metrics that matter for SaaS entrepreneurs to raise capital and scale a business have largely remained consistent – and so too have performance targets. This is not surprising as the pricing, distribution and service models of today’s SaaS businesses have varied little in the last five years.
Hence, Insight has made minimal changes to the core elements included in our Periodic Table. In fact, as focus is critical, we elected to remove a few non-essential, “inert” elements and recommend that entrepreneurs monitor the following 5 fundamental elements:
- Bookings Growth: How quickly are you adding new contracts and revenue year-over-year or quarter-over-quarter? Annual ARR growth is a key indicator.
- Gross Margin: What does it cost to deliver your solution? We monitor both blended and subscription gross margins.
- Acquisition costs: What does it cost to land an incremental dollar of revenue? We track payback months or how many months a customer needs to remain in order to recoup your sales and marketing investment.
- Retention rates: What can you expect existing customers to spend in subsequent years? We track net retention to understand the baseline of your growth rate or how much you would grow with no new business.
- Cash Flow: What are you investing in your product innovation, go-to-market and general operations? We track Operating Free Cash Flow and specific cost categories like research & development as a percent of revenue.
Insight’s Periodic Tables can be used to both benchmark your businesses’ performance against these five fundamental elements, and inform your financial plans.
Changes in target performance
We also analyzed how target performance has changed in the past five years. We found that while software growth remains robust given the persistent demand for efficiencies and digital transformation across industries, competition is likely increasing – evidenced by higher acquisition costs and lower gross retention. Also, the customer segment that’s being targeted matters.
Here are 4 observations from parsing through our dataset:
1) SaaS growth rates remain strong.
The annual revenue growth rate for an average growth-stage1 SaaS business is 40% - 50%. Average growth rates appear to have increased slightly in the last five years: in our private company dataset we see small improvements in annual revenue growth from 2015 – 2019. In private markets, venture and growth investors have been willing to reward this faster growth with higher valuations.
| Annual Growth Rate | 2014 | 2018 | Overall: 2012 - 2018 |
| 50th Percentile | 39% | 52% | 40% |
| 75th Percentile | 73% | 74% | 74% |
2) Acquisition costs have increased.
The cost of acquiring new revenue appears to be rising. You can see this trend in annual industry reports2. In our private company dataset, we find a ~15% increase in acquisition costs in the last 5 years across scale (i.e., revenue size) and customer segments.
3) Net retention is stable; gross churn ticking up.
Average net retention is stable around ~105% and best-in-class remains 120%+. Gross churn, however, has increased a few points from 6% - 7% to 8% - 10%.
4) Target customer segment is predictive of retention and acquisition costs.
We continue to find a bifurcation in the benchmarks for the fundamental elements by target customer segment, so we added the ability to toggle the Periodic Table by target customer segment.
Particularly for retention and acquisition costs, the best-in-class goals differ between small contracts sizes sold to small or very small businesses versus larger contracts sold to enterprises. For example, a small business may purchase over the phone in a sales cycle measured in weeks, while winning a large enterprise contract may require a year or more to sell and involve multiple teams including a procurement department. Similarly, when it comes to retention, small businesses are more likely to go out of business which creates structural, uncontrollable churn. Established enterprises typically have more stable budgets and higher retention rates We acknowledge that many businesses are a hybrid and encourage you to track end-customer segments separately when possible.
Benchmark your growth formula
You can benchmark your growth formula by exploring our Periodic Table. You can double click on the foundational elements of SaaS and see how your business stacks-up. Since we know that appropriate performance targets depend on your growth rate, scale and target customer segment, we enable you to select the categories that are best suited for your business.
Of course your metrics will be different, and, at times, with good reason. Our goal is to show how you compare with best-in-class targets by pricing, customer unit economics, bookings & retention, gross margins, and profit & OpEx.
What is our best advice on the magic elixir? Experiment with the growth potion, but always monitor the core elements to ensure the key ingredients are in the right ratios.
1 For purposes of this analysis, growth-stage defined as SaaS business $10M in Revenue to $100M in Revenue
2 For example, Key Banc’s SaaS survey where acquisition costs increased ~20% from 2013 to 2018