Back
Marketing KPIs That Matter (Spoiler: It’s Not Just MQLs)
Charlene Chen | May 23, 2018| 1 min. read

CTR? CPL? MQL? There are many ways to look at marketing performance (and just as many acronyms). But what are the KPIs that really matter? Learn about how we at Insight look at marketing performance.
KPIs vs. Metrics
Before we dive in, a note: all KPIs are metrics, but not all metrics are KPIs.
There are countless metrics that marketing teams should be monitoring and tracking. However, only some of these will rise to the ranks of KPIs. Even fewer will be external KPIs—those that matter to people outside of the company.
Three Key Questions and Their KPIs
We regularly hear three key questions about marketing performance:
1) How is marketing driving new business bookings growth?
While all three questions are important, the first one gets the most airtime. Consequently, the main KPI we focus on is marketing sourced new business opportunity dollars. We look at opportunity dollars instead of bookings since it’s a direct driver of bookings and localized to marketing (i.e., no controversial caveats around sales execution). It’s also a warning sign—if not enough opportunity dollars have been created, or if the amount is trending down, we know there’s risk to hitting future bookings targets.
2) What can we expect going forward?
This dovetails into the second question around outlook and another KPI — marketing sourced new business open pipeline. Specifically, is the pipeline value growing? Ideally, we’d like to also compare this value to marketing sourced new business bookings targets for the next quarter.
3) How efficiently is growth being driven?
Lastly, there’s efficiency. How efficiently is marketing driving growth and how is that trending? Here we focus on cost per new business opportunity dollar (i.e., marketing program spend / marketing sourced new business opportunity dollars) and, to a lesser extent, cost per booking dollar (i.e., total marketing spend / total booking dollars with an appropriate time lag on the bookings).
...And Four Early Warning Signs. Wait, Isn’t This Post Done?
In addition to the above, we also look at four early warning signs. The Board won’t necessarily look at these, but we do in the Insight Marketing COE and encourage our portfolio marketing teams to monitor them as well. These are:
- MQL Volume
- MQL to Opportunity Conversion Rate
- Average Deal Size
- Cost Per MQL
These four warning signs work together to drive marketing effectiveness and efficiency. It’s not enough to look at just one or two—you need to look at the interaction of all four (okay, technically, it’s just three at a time).
See below for three examples to drive home this point.
*Note: It's not enough to look at just one or two. You need to look at the interaction of all four (okay, technically, it's just three at a time).
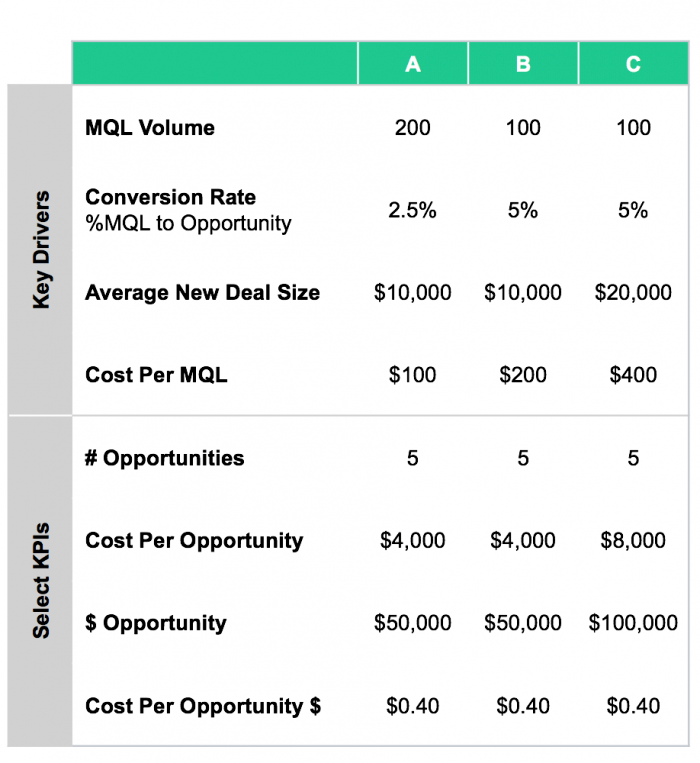
1) A vs. B for effectiveness
If you just looked at MQL volume, a commonly used marketing KPI, you would conclude that scenario A at 200 MQLs is better than scenario B at 100 MQLs. However, when you factor in the conversion rates, the number of opportunities is the same. In a world where the average deal size is the same, the opportunity dollars is also the same. If you assume the same sales execution, you are probably equally happy with A and B. You may even prefer B since there are fewer leads for sales to manage.
2) A vs. B for efficiency
Let’s look again at A vs. B but with an efficiency lens. If you looked at just cost per MQL, you would say that A at $100/MQL is preferable to B at $200/MQL. However, again, you need to factor in conversion rates. When you do, the cost per opportunity is the same, and in a world where average deal size is the same, the cost per opportunity dollar is the same as well. So again, it’s not the case that A is preferable to B.
3) B vs. C and the impact of average deal size
In the prior examples, we kept average deal size the same. However, for many of Insight’s portfolio companies (and ScaleUp companies generally), average deal size is not the same. In fact, most have an initiative or two (ahem, ABM) in place to drive up the average deal size. Average deal size can also shift with marketing channel mix. These are all reasons why it’s critical to factor in average deal size when assessing marketing effectiveness and efficiency.
- Effectiveness: MQL volume and conversion rates are the same for B vs. C, meaning the number of opportunities is the same. However, would you choose B over C? While there is the same number of opportunities, the value of the opportunities is different. C, with the higher average deal size, is generating 2x the dollar value of opportunities.
- Efficiency: The cost per MQL for C is 2x that of A and the cost per opportunity is also 2x. However, you need to again factor in the larger average deal size (this, by the way, is why we look at cost per opportunity dollar and not just cost per opportunity). When you look at cost per opportunity dollar, B and C are equally efficient. Overall, C is probably more efficient when considering the sales effort to qualify the leads.
In Summary
Here are some key takeaways:
- When it comes to external marketing KPIs, make sure to simplify and educate.
- Focus on opportunity dollars, the opportunity pipeline, and cost per opportunity dollar.
- KPI trends are just as important as the KPIs themselves—look at YoY and QoQ changes.
- Never just look at MQL volume or cost per lead—these are meaningless numbers on their own.
…With Some Caveats
As with all things to do with marketing KPIs though, it’s a bit more complicated than what we’ve laid out here. There are some additional details and caveats that we normally add when working through this with portfolio companies.
For example:
- For conversion rates, we actually look at an end of quarter conversion rate—i.e., of the MQLs generated this quarter, what percent converted to opportunities by the end of the quarter (note: always on a cohort basis). This conversion rate is highly correlated to the longer-term MQL to opportunity conversion rate and acts as an early indicator.
- We also look at other KPIs that didn’t make it on this post. Top of mind are marketing sourced bookings, opportunity to won conversion rates, funnel velocity, and program spend ROI. As the Marketing COE, we do ask for these numbers when working with our portfolio companies and encourage CMOs to track them.
- Then there is the issue of attribution and marketing influence. When is this ever not an issue? We believe strongly that each type of attribution model has an important role in marketing reporting and which model you use depends on the question being asked. We also understand that this concept of marketing sourced (vs. influenced) can be controversial within an organization, often causing misalignment between sales and marketing. All that said, we have focused on using first touch attribution for external KPIs for a couple of reasons:
- It’s easy to understand for people who aren’t in marketing (i.e., the Board).
- Every company can do this, providing a consistent definition across companies.
- For most our portfolio companies, marketing is focused on new logo lead gen. Using first touch attribution makes the early warning signs work more effectively.
One final caveat: These KPIs were designed for a traditional funnel. For companies implementing ABM, the KPIs will be different.