Reverse Funnel Math: The Science of Hitting Your Number

The first commandment of sales is hit your number. Too often, sales reps understand this to mean this quarter’s number. They devise ever-more-creative ways to pull deals forward from future quarters, and sales leaders push them to get that “Hail Mary” deal done, to do the superhuman in order to eke out a win against all odds.
Closing deals is critical, but in our rush to focus on the current quarter, we forget that we can close only what is already in play. Effort at the top of the funnel – prospecting, qualifying inbounds, and finding opportunities with existing customers – is a big driver of whether your team is gliding to a strong finish a few quarters out, or trying to pull a rabbit out of a hat.
Step one in this reorientation is understanding exactly how much pipeline is needed to hit your overall number – doing what is called ‘reverse funnel math’. With the right pipeline targets, coupled with clear and regular reporting, sales leaders can improve forecasting accuracy, more quickly identify issues, and remedy those issues before it’s too late.
Let’s explore how to set those pipeline targets.
Set Starting In-Quarter Pipeline Targets
At the end of the quarter, your bookings are composed of the portion of starting in-quarter pipeline that successfully converted. Here is the basic premise of reverse funnel math: if you know the portion of your pipeline, on average, that converts by the end of the quarter (i.e., conversion rate), and you know your bookings goal, you can divide the two to set your starting pipeline target. For example, if over the last 3 quarters, you entered the quarter with about $8M in pipeline set to close that quarter, and you closed $2M in bookings, your conversion rate is ~25% ($2M / $8M). If your bookings goal next quarter is $2.5M, all else being equal, you should have $2.5M / 25%, or $10M, in pipeline at the start of the quarter.
That’s simple enough, so consider a few nuances. First, the maturity of the pipeline – that is, the sales stage of each opportunity. Next, depending on the sales cycle length, a meaningful portion of your quarterly bookings could come from ‘invisible pipeline’ that isn’t in the pipeline on day 1 but is created and closed within the quarter. Lastly, some of your quarterly bookings could be pulled forward from future quarters, closing sooner than expected.
Let’s use an example and the diagram below to incorporate these complexities. Let’s assume there are only four stages of an opportunity: early stage (probability <50%), late stage (probability 50-99%), closed won, and closed lost.
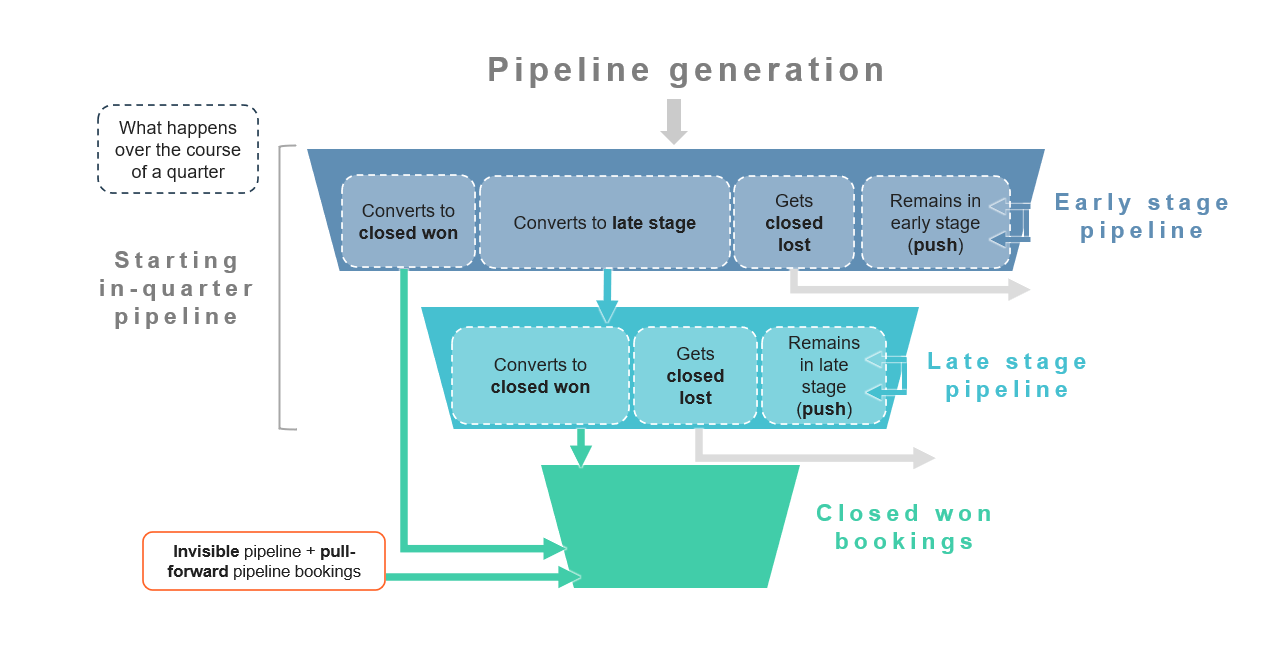
Here are some assumptions:
- Of your starting in-quarter early stage pipeline, by the end of the quarter,
- 30% converts to late stage
- 12% converts to closed won
- 10% gets closed lost
- The remainder pushes to the next quarter
- Of your starting in-quarter late stage pipeline, by the end of the quarter,
- 45% converts to closed won
- 20% gets closed lost
- The remainder pushes to the next quarter
- Your bookings goal for the quarter is $2.5M
- You expect ~$300K in invisible pipeline bookings and pull-forward bookings
Doing the reverse funnel math, you should have $3.1M of late stage pipeline and $6.7M of early stage pipeline entering the quarter in order to hit your bookings goal of $2.5M. Use our template to do this calculation for your own business by completing the form at the bottom of this article.
Set Weekly Pipeline Generation Targets
Now you know precisely how much ‘stock’ of pipeline you need on day one to be set up for success this quarter, so how does this translate to how much pipeline you need to generate on a weekly or quarterly basis to prepare for future periods? It’s simple: you ‘re-stock’ the early stage pipeline. In our example, 52% (30% + 12% + 10%) of early stage pipeline is depleted over the course of the quarter, so your team must generate $3.5M (52% x $6.7M) of pipeline each quarter, which equates to $270K ($3.5M / 13 weeks) per week.
To really empower sales teams, take the reverse funnel math to the next level with weekly activity targets that empirically tie to that $270K per week new pipeline target. For example, if the average deal size is $45K, you must create 6 ($270K / $45K) opportunities per week. If 50% of discovery calls convert to opportunities, you need 12 (6 / 50%) discovery calls per week. If 10% of sales-accepted leads (SALs) convert to discovery calls, then SDRs need to qualify/disqualify 120 (12 / 10%) SALs per week. If you need 120 SALs per week, you need x calls and y emails. Run the numbers to determine precisely what reps must do on a weekly basis, so in the long run, it’s clear what they need to do in order to be successful.
Get the Data You Need
The difficult part of all this analysis is obtaining your team’s actual conversion rates in order to do the funnel math. To get the data, you need to pull information from your CRM. Here are two tips to get started.
The first requirement is historical opportunity reporting: the ability to take a point-in-time snapshot of your pipeline and track how it evolves over time. Here are two options in Salesforce.com, the most commonly used CRM across Insight’s portfolio:
- Opportunity Trends report. Out-of-the-box, SFDC snapshots your opportunities on the first day of each month, capturing four key fields: stage, $ amount, close date, and probability.
- Opportunity Field History report. First, you must go to the Object Manager, click “Set History Tracking”, check the box for “Enable Opportunity Field History”, and select the fields you want tracked. Going forward, SFDC will record and time-stamp each change to these fields, and you can report on them with the Opportunity Field History report type.
Alternatively, purchase a revenue operations platform, like InsightSquared or Clari, which extends CRM capabilities and automates some of the analytical workload.
The second requirement is, of course, to enforce good sales hygiene by sales reps. That means opportunity owner, close date, stage, and $ value are accurate at all times, especially (i) at the start of a new quarter and (ii) just before you pull the data each week.
Not All Opportunities are Created Equal
If the reverse funnel math shows that your team needs a lot more pipeline, that might lead to a mad dash to create opportunities that aren’t real opportunities. This is a mistake we see all too often, and it is paramount that sales teams maintain their qualification discipline – and that pipeline reviews ferret out what’s real from what’s not. Be sure that stage one opportunities have clear seller and buyer criteria that must be met to become “official” pipeline. An overstated pipeline has its reckoning at the end of the quarter when you miss your number and your Board asks what happened?
Wrap Up
If every quarter feels like a heroic effort to beat the odds, it’s time to refocus. Do the reverse funnel math and determine precisely what you need at the top of the funnel so that each quarter kicks off with enough pipeline while your team is focused on building for out quarters, even as the focus is on the current quarter.
Once you understand the top of funnel pipeline targets, it is imperative to tenaciously manage progress against those targets, staying ahead of issues rather than playing catch up. Ultimately, you’ll find it much easier to hit your number quarter after quarter if you’ve done the math, and constantly iterate to improve the math as more data becomes available.
Access Insight’s Reverse Funnel Math
Please enter your information and make a copy of our template to do this calculation for your own business.