Shirley Lin
More By The Author
Back
The Data R&D Leaders Need to Make Investment and Organizational Decisions
Shirley Lin | December 15, 2021| 1 min. read

Some of the most common questions we get from R&D leaders of ScaleUp software companies are around how much they should invest in their R&D organization and what their organization composition should look like at various stages of growth, and within their industry.
As R&D leaders, we know that answering these questions is crucial when it comes to making the case to scale your team and executing against your company’s product strategy. In this blog post and accompanying downloadable report, we share various R&D investment and organizational trends derived from financial and headcount data across Insights portfolio of ScaleUp companies. Our goal is to empower you as a R&D leader to consider these trends in conjunction with the nuances of your organization. These trends should serve as one of many guiding inputs to your decision-making.
How much should I spend on R&D?
Based on the trends, it depends. However, it is probably more than you think.
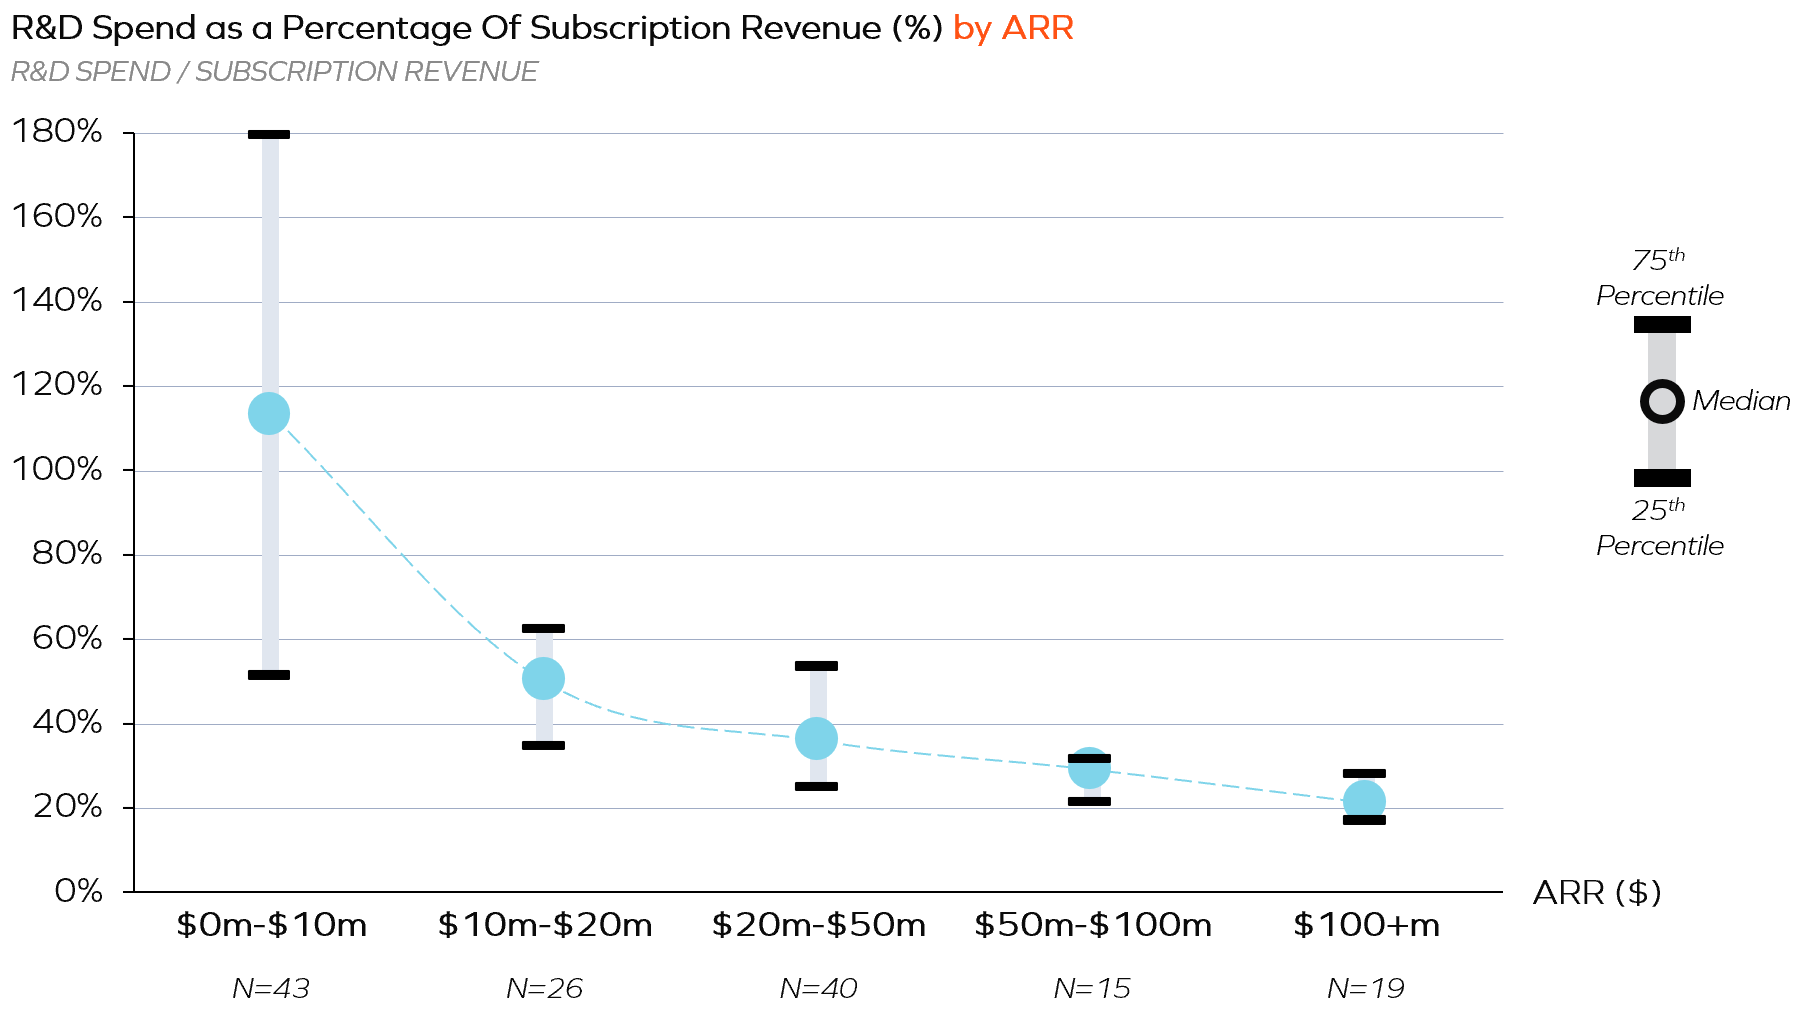
R&D spend should vary depending on ARR. Lower ARR companies spend more on R&D as a percentage of revenue than higher ARR companies. Looking at Insight’s SaaS ScaleUp companies, earlier-stage (i.e., lower ARR) companies across industries and ARR size spend over 100% of their subscription license revenue on R&D. This trends down as ARR grows, eventually plateauing at ~20% for companies exceeding $100 million in ARR. The reason for this is two-fold. First, companies improve their portfolio management strategies as they grow, resulting in increased R&D efficiencies and decreased R&D investment. The second reason, which Insight believes to be the more salient explanation, is that revenue grows faster than companies can invest (e.g., hire) in R&D, resulting in decreased investment relative to recurring revenue.
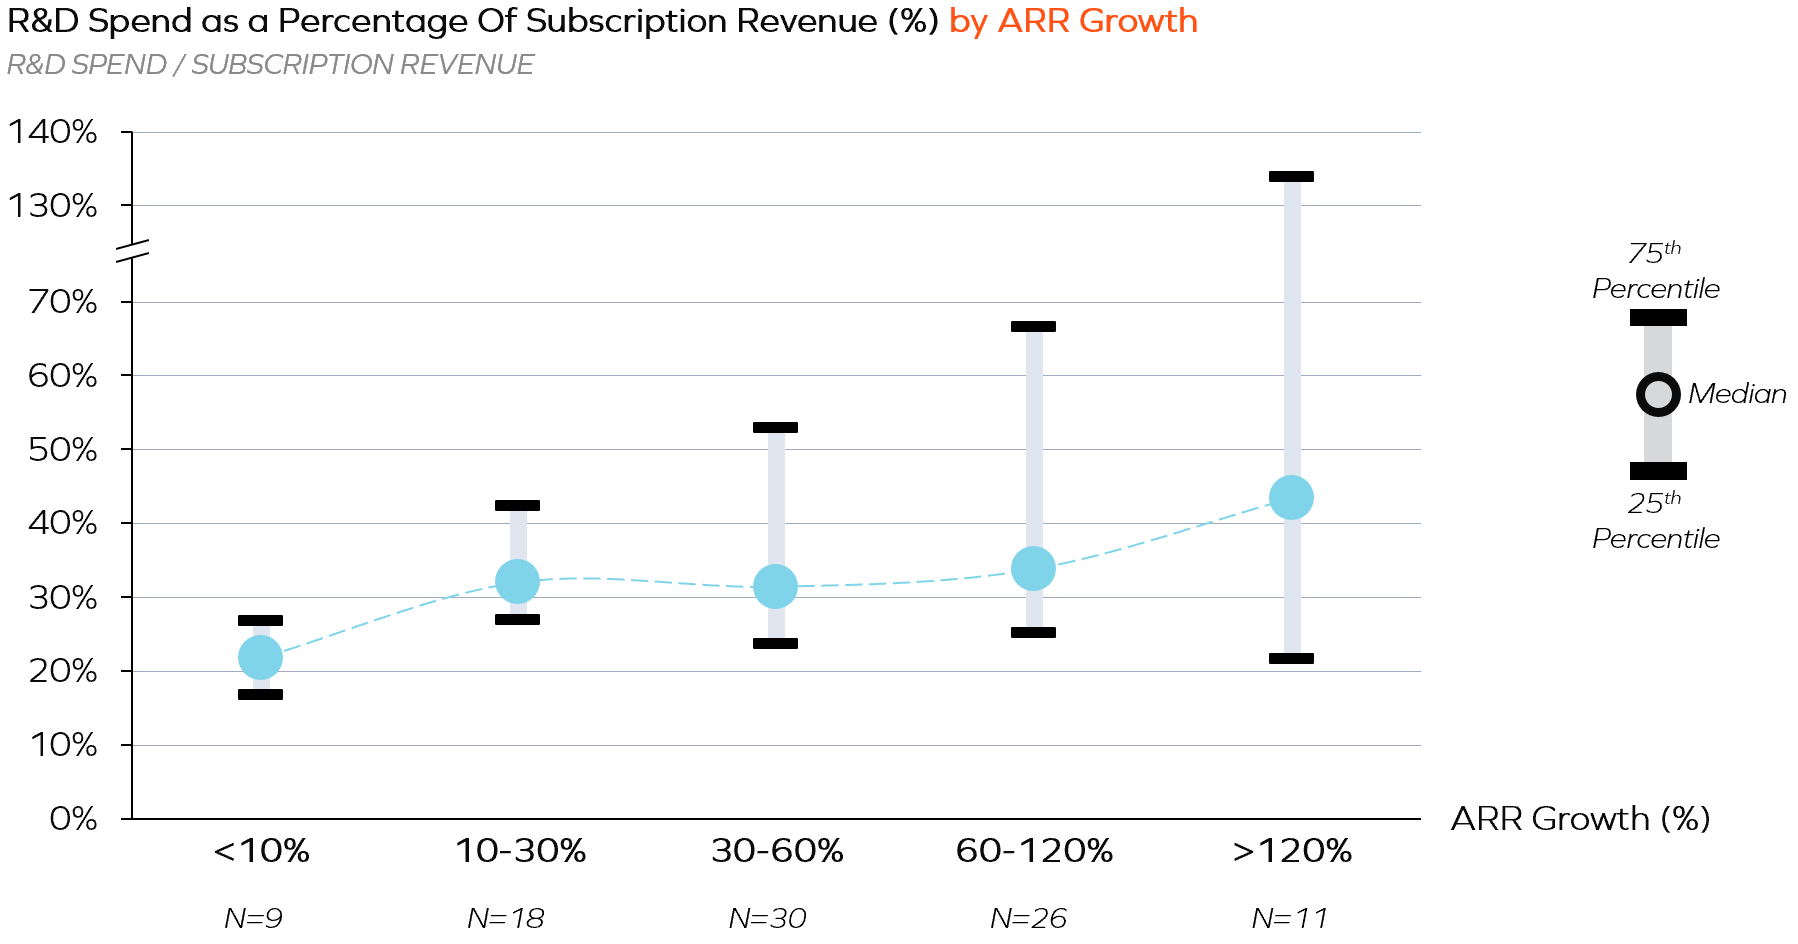
R&D spend should vary depending on ARR Growth. Higher revenue (ARR) growth companies - across size and industry - are spending a higher percentage of subscription license revenue on R&D compared to slower growing companies. It is important to note that even companies with sub-10% ARR growth are still investing ~20% of their subscription revenue on R&D. Companies experiencing higher growth are investing proportionally more in R&D as they work to expand their product(s) and support that growth.
R&D spend varies by industry. How much a company spends on R&D varies heavily depending on the vertical the company plays in. Overall, faster-growing industries (e.g., Cybersecurity, Data) are likely spending more on R&D as a percentage of revenue compared to more longstanding industries. The higher spend is to secure competitive differentiation given the fiercely competitive nature of industries that are undergoing distruption and change (e.g., healthtech, AI, logistics)
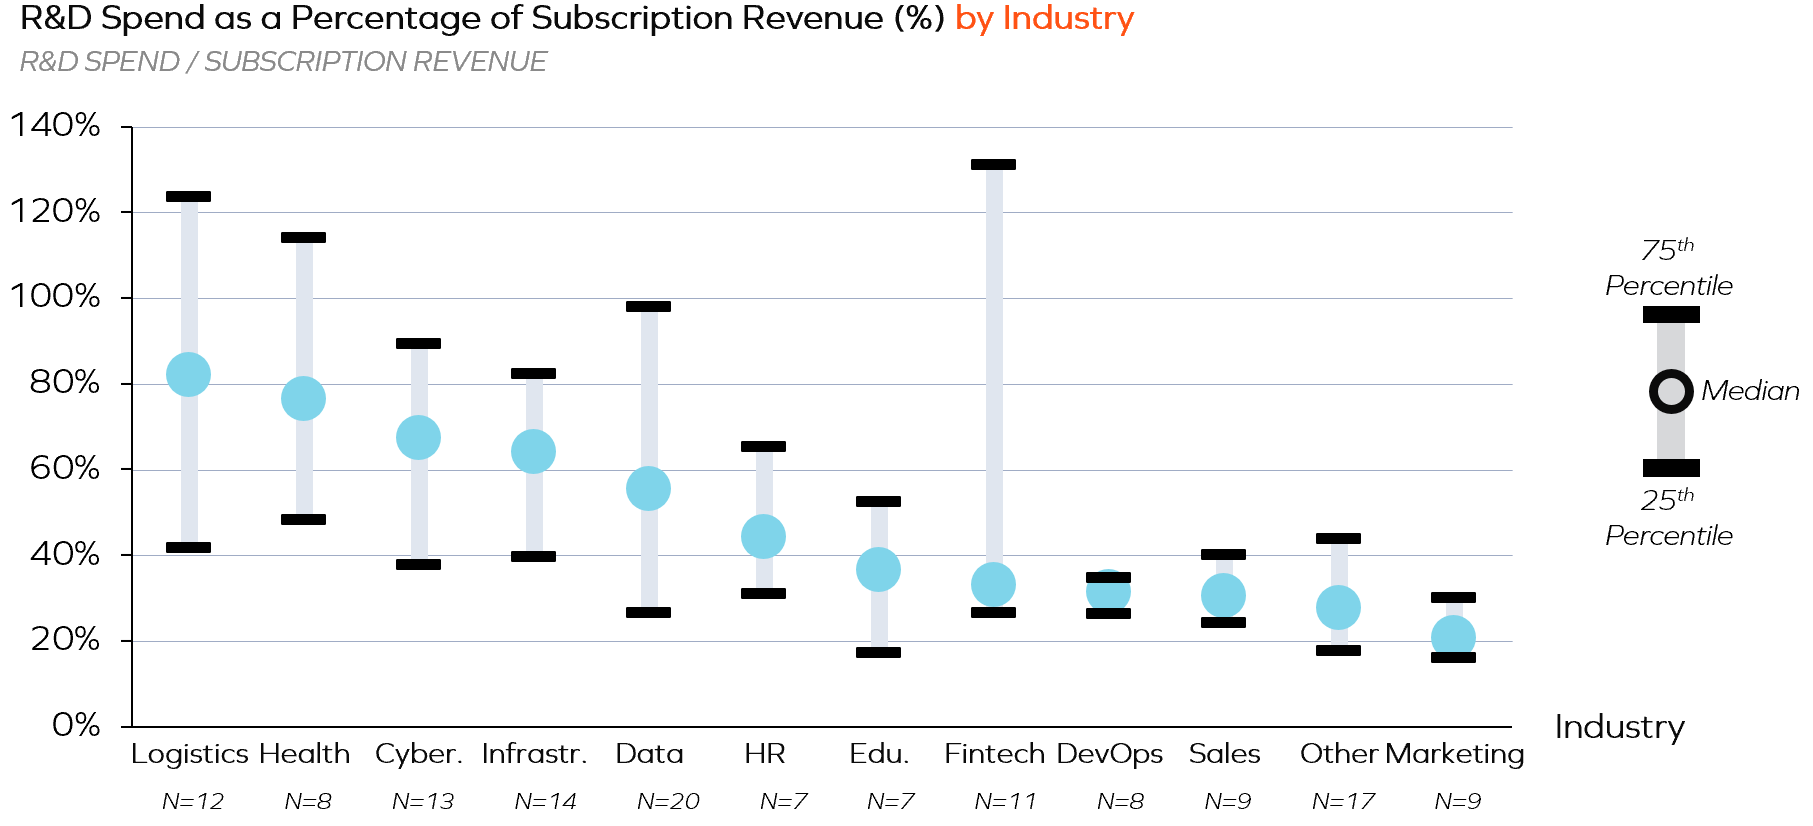

However, it is important to consider these trends in the context of ARR and ARR growth, which are not uniform between industries. For example: If you are a $100mm+ Data company with no top-line growth, you are likely well below the 25th percentile of the R&D Spend / Subscription Revenue for your industry. On the other hand, if you are a $10mm ARR Cybersecurity company growing at 80%, you should likely be well above the 50th and perhaps even above the 75th percentile depending on the nuances of your business.
These trends across Insight’s ScaleUp SaaS companies suggest that R&D is not a cost center! Rather than intentionally scaling down spend on R&D as your company grows, continuing to invest in R&D at the same pace is crucial to continue innovating, growing, and differentiating. However, Insight believes that how much to spend on R&D does vary heavily on a company-to-company basis -- beyond ARR, ARR growth, and Industry, there are many other reasons companies may be spending more or less on R&D compared to their peers.
What could cause higher R&D spend as a percentage of license revenue?
- Recent financing
- Launching new product(s)
- Replatforming to next generation architecture
- Less-established industry
- Strong product-led motion
- Inefficient R&D org and processes
What could cause lower R&D spend/license revenue?
- Highly efficient R&D org and processes
- Lack of innovation
- Cost reductions as a result of lower demand (e.g., global pandemic)
- More-established industry
- Fast revenue growth
- High-offshore/low-cost center usage
So, how much should I be spending on R&D? It really depends. Use these trends and the broader, likely nuanced context of your company to determine a healthy range for R&D spend.
What should my ScaleUp R&D organization look like from a headcount perspective?
R&D organizations across the Insight portfolio vary widely from a headcount perspective, but some trends appear salient across the portfolio as seen below.
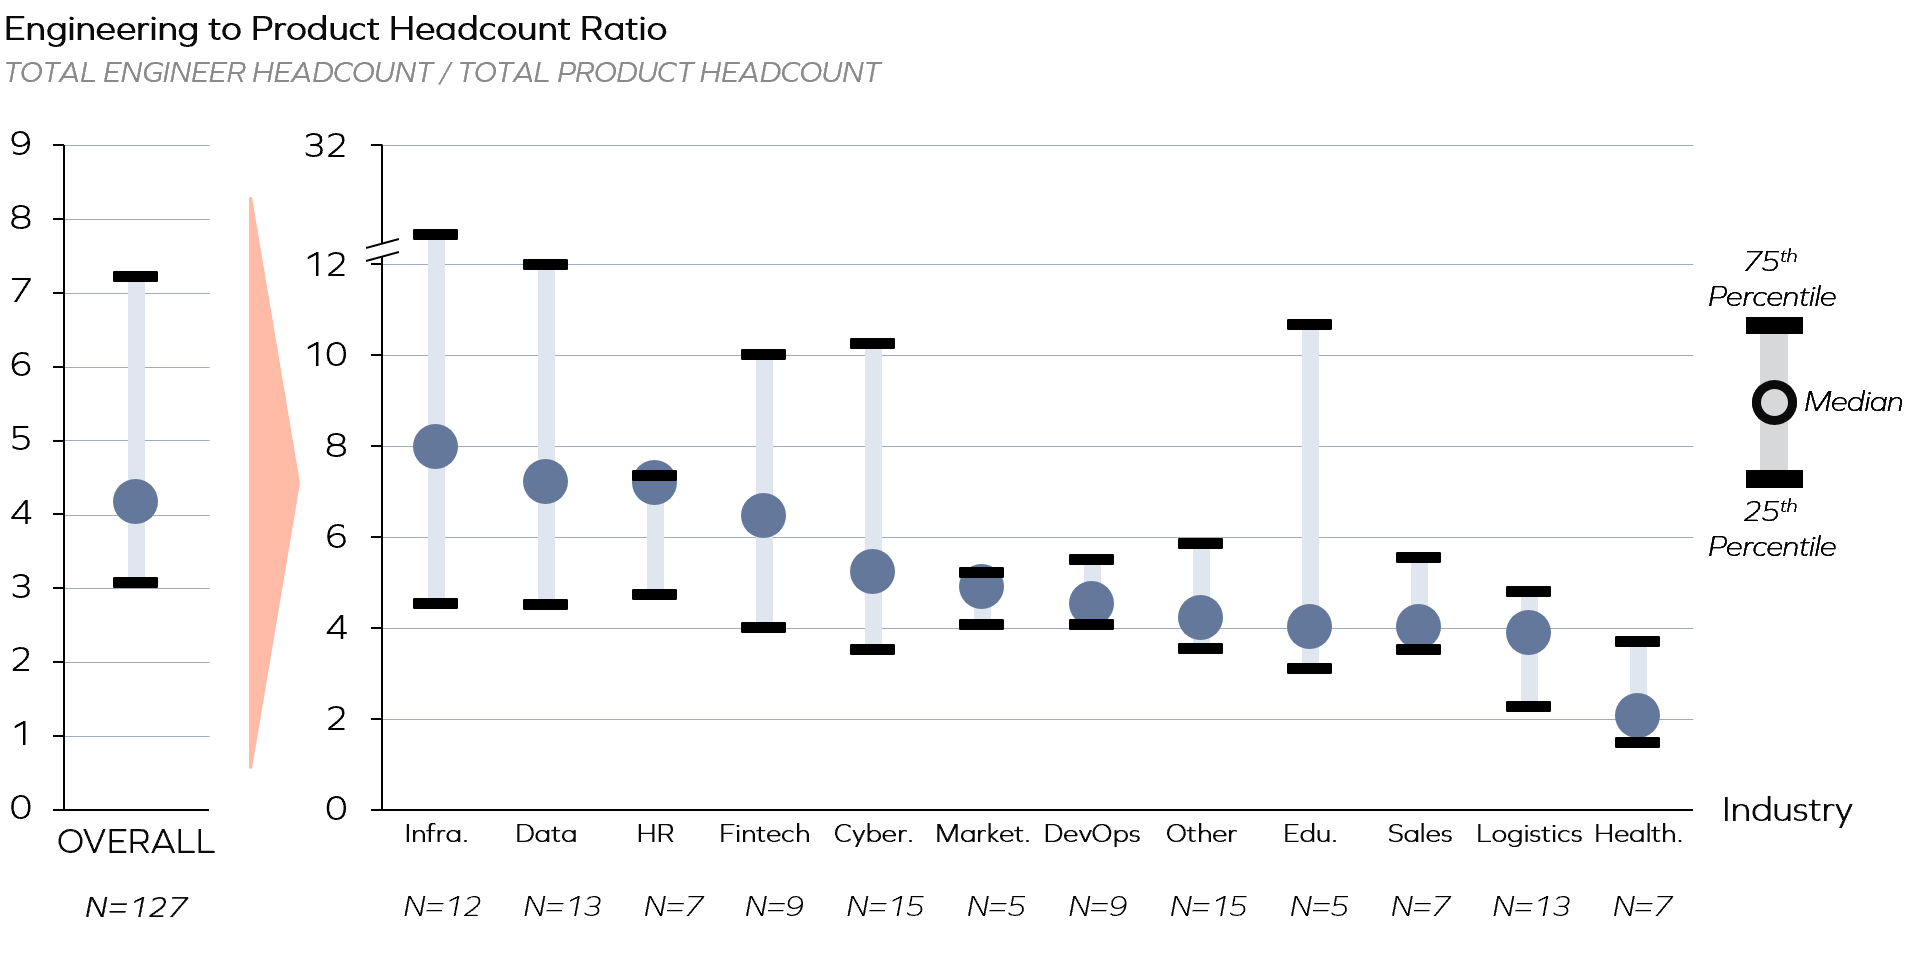
Companies typically have 4-7 engineers per product employee, where product includes product managers, UX designers, technical writers, etc. While this does appear to vary across industries, with Infrastructure and Data companies at the higher end of the spectrum, most companies fall within the 4-7 engineers per product person range.
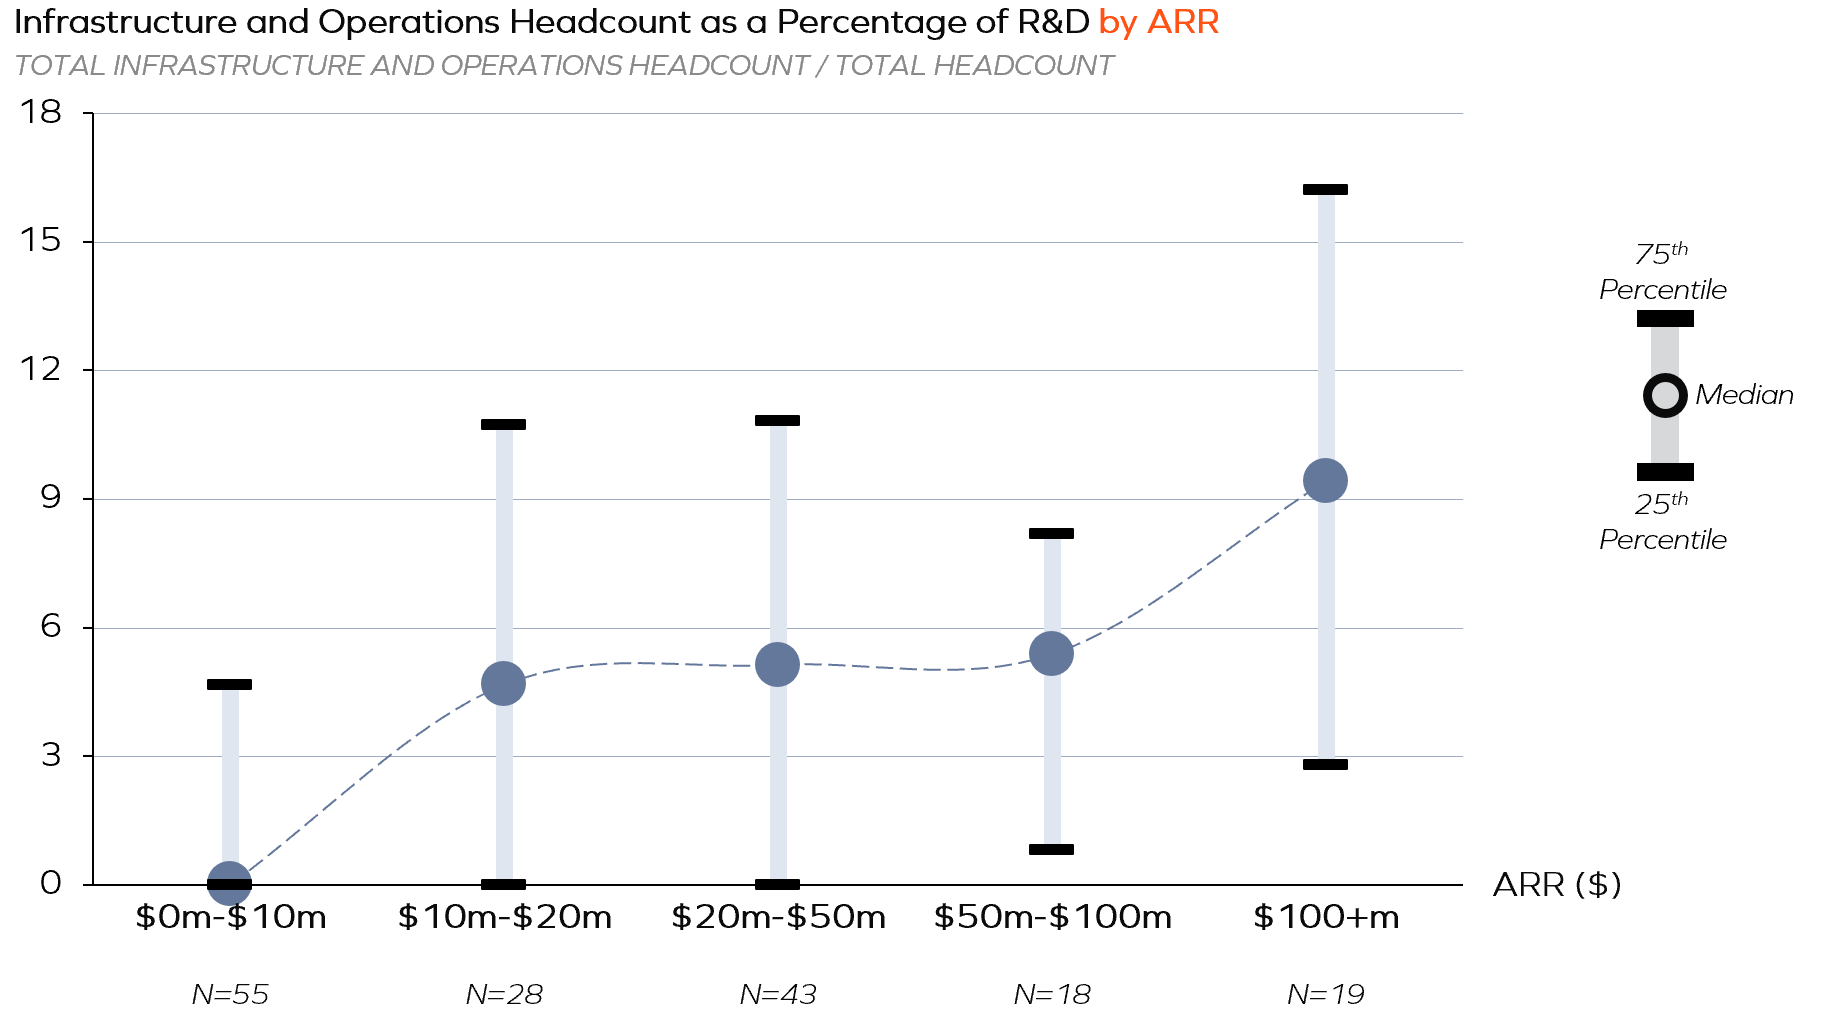
Infrastructure and Operations headcount grow as companies grow ARR, evolving from a shared responsibility across the R&D organization to a dedicated function. $20mm-$50mm ARR appears to be an inflection point that sees companies begin hiring dedicated Infrastructure and Operations personnel, either as embedded DevOps team members or as a dedicated Infrastructure and Operations Team. From there, Infrastructure and Operations headcount as a percentage of total R&D headcount grows non-linearly with infrastructure load but should taper off at scale due to infrastructure efficiencies gained.
What’s Next?
Please download the full "ScaleUp R&D Investment and Organizational Trends" report by completing the form below.
Furthermore, Insight is excited to announce that we will be releasing an updated trends report annually for your consumption, with the next report coming out in mid-2022. As we continue growing our portfolio and developing our data strategy, we expect to provide reports like this to empower leaders to make more data-informed decisions.
For any feedback, questions about this report, or to learn about future reports, please email ProductOnCall@insightpartners.com.
2021 R&D Investment and Organizational Trends
Download to review present trends in R&D investment, outcomes, and organizational composition by revenue, growth, and industry.