Cram the last suitcase into the car trunk, check that the last bathroom light is switched off, and the front door locked. Take a deep breath as you back out of the driveway and hit the road. With a mix of excitement, anticipation and uncertainty, you’re on your way!
The first thing you pull out is your google maps, waze and planned itinerary. You’ve flagged the local eateries and recommended attractions en route. You’re in the driver’s seat, and it’s time for an adventure - one mile down and 3,000 to go.
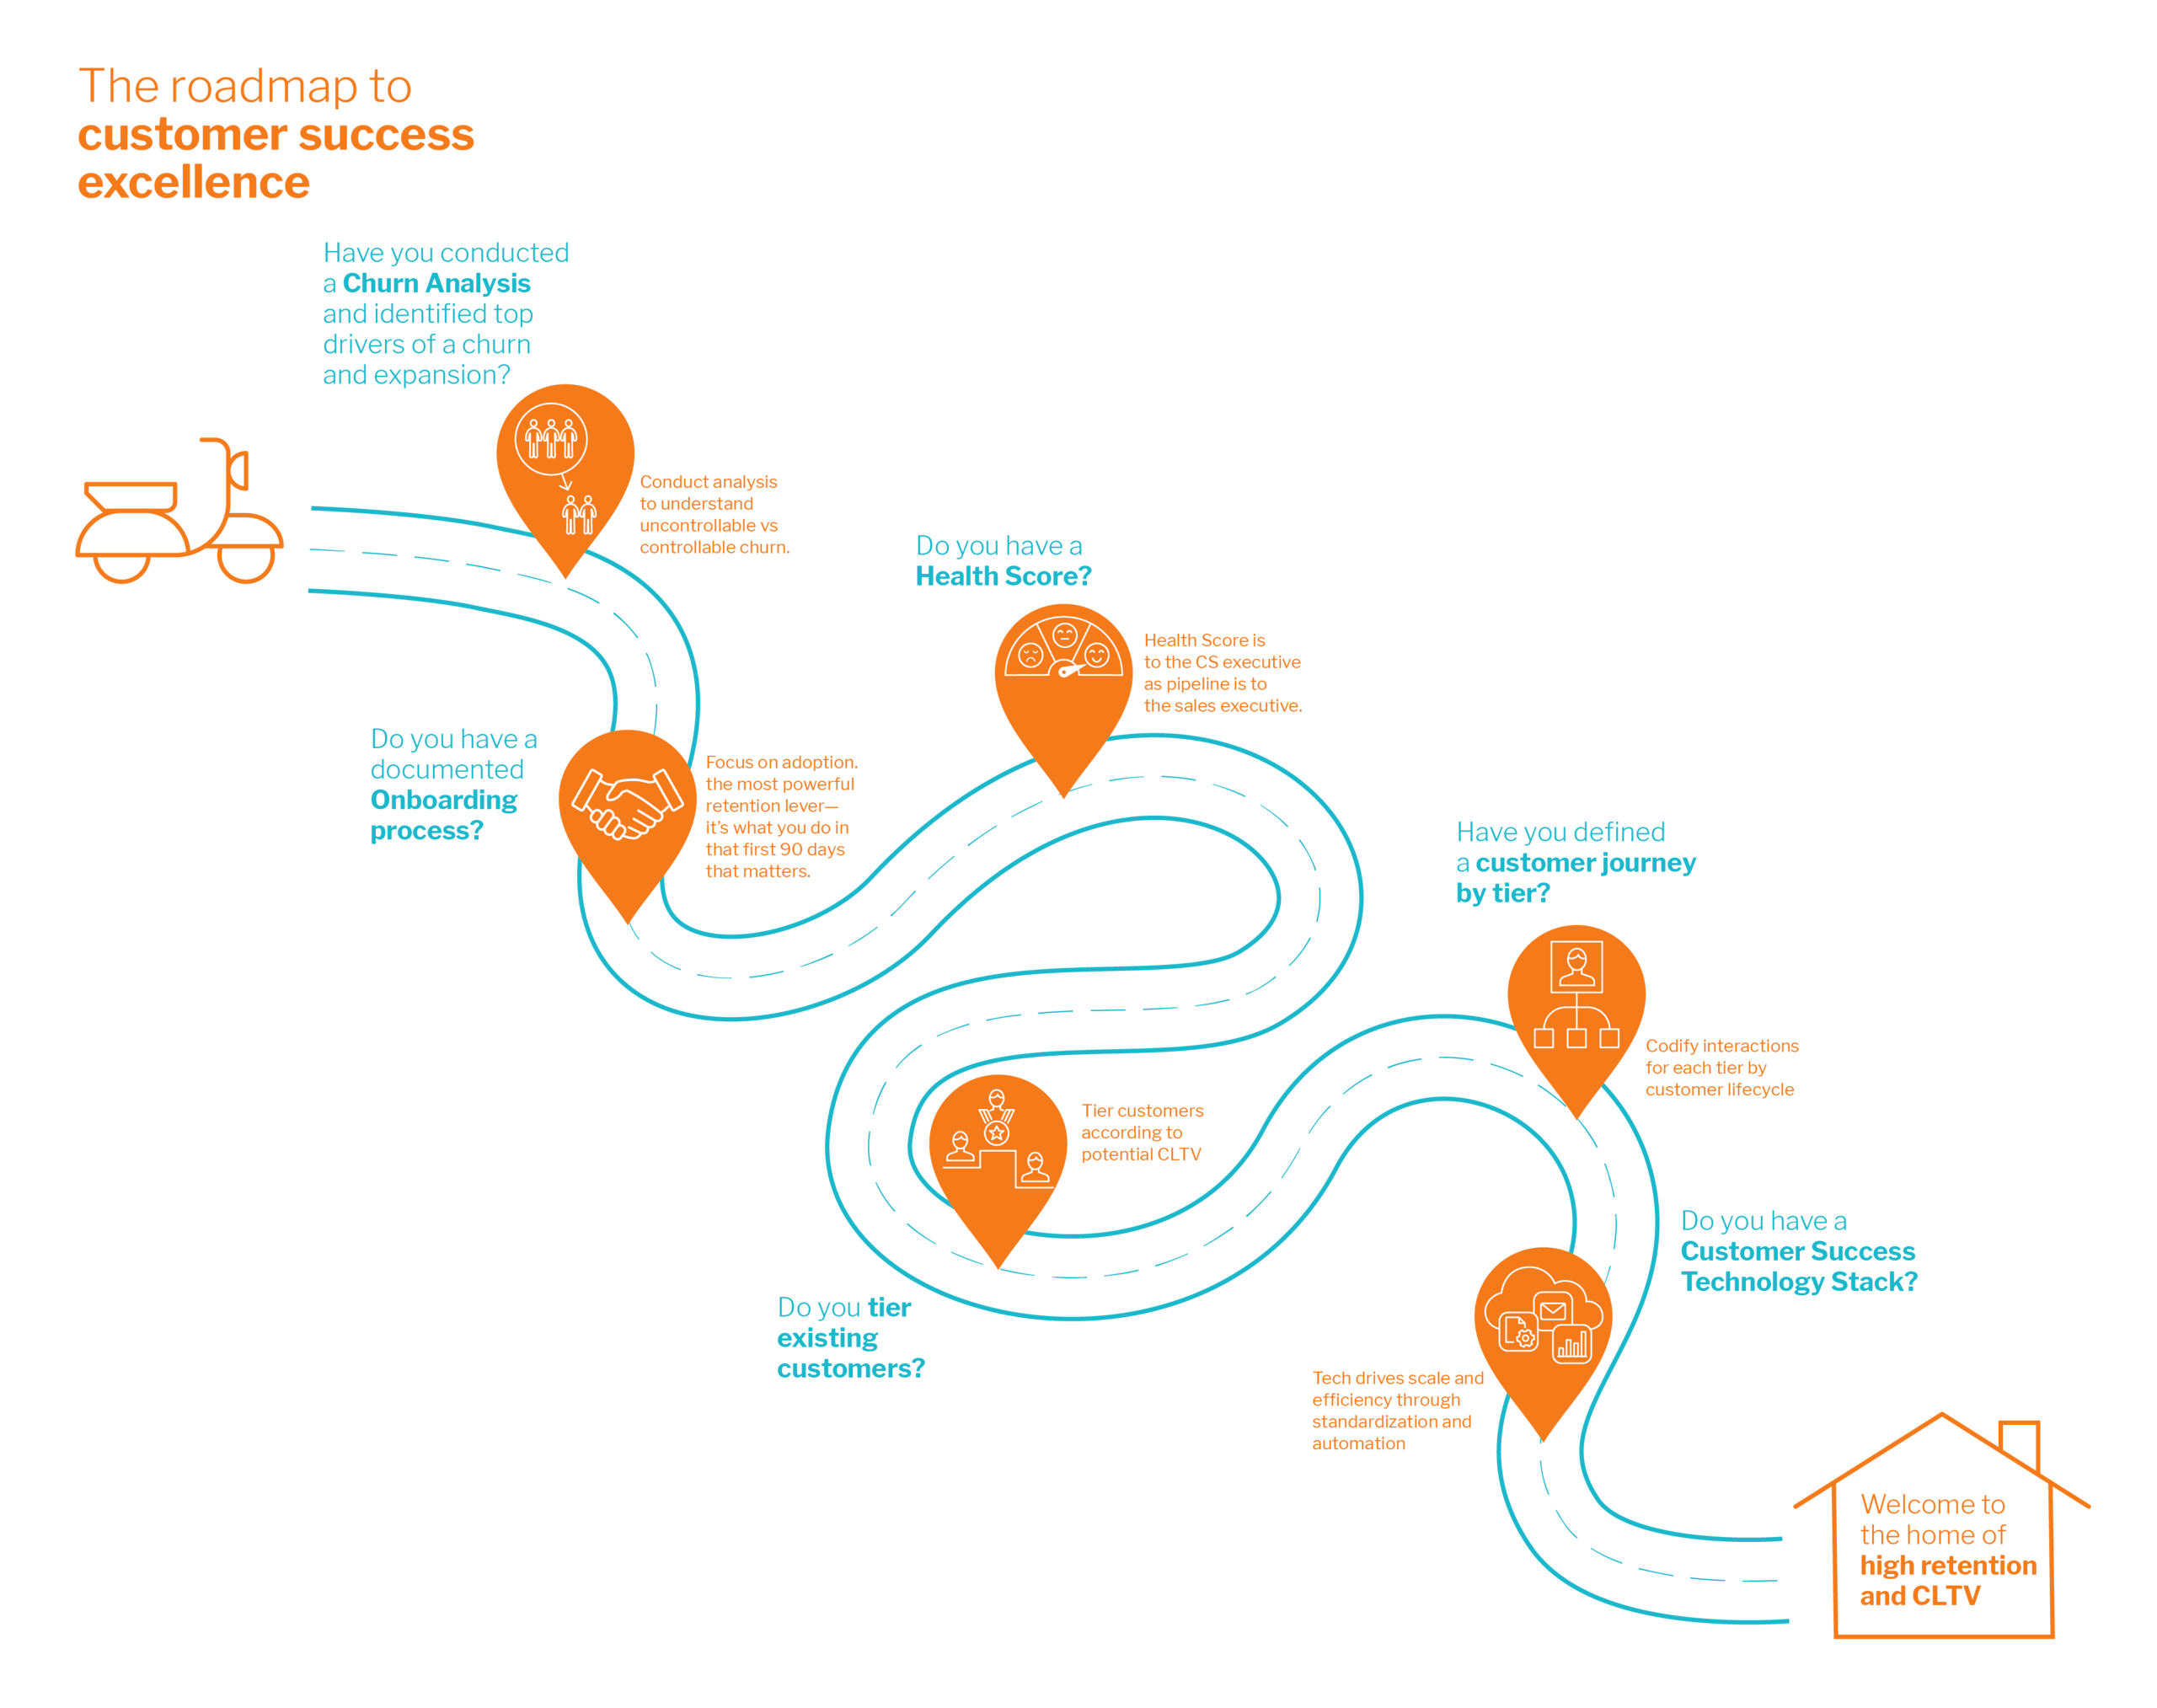
Building and scaling a Customer Success motion is like a long road trip, and there are rarely shortcuts. You must pack the car, outline your route and milestones, and get the internal team on board. As a Customer Success executive, you are an explorer – leading your organization and customers and charting new paths for customer engagement in the Cloud Era.
By working with SaaS companies across our portfolio, Insight has identified the potholes, traffic jams, and hidden turns on the road to Customer Success excellence.
Our roadmap provides a guide whether you’re on a new journey to introduce or revamp your Customer Success motion, or, you are searching for a more efficient route to Customer Success outcomes.
Buckle up and don’t forget your CS roadmap!
Notes:
1Churn is the number or percentage of customers that cancel (or reduce) their subscription over a specific time period. SaaS companies calculate three types of churn - gross dollar7, net dollar8, and logo9 to understand customer behavior.
As the Customer Success leader, calculate your 3 churn metrics and establish a baseline.
Then, investigate the reasons why customers are leaving (or reducing spend). List all the reason that customers churn. Common culprits include service has not delivered expected value and relationship changes (e.g., loss of sponsor, lack of senior stakeholder engagement, etc.). Classify the reasons as controllable and uncontrollable.
- Controllable churn are factors that a CSM or other part of the business can influence. An example is “customer did not see value” or “customer chose a competitor.”
- Uncontrollable churn are factors which CSM intervention cannot change. Common examples of uncontrollable churn are M&A or bankruptcy.
Churn analysis is the process of dissecting your churn metrics to understand why customers are leaving (or expanding) and when they are leaving (or expanding) in order to build a realistic intervention plan. Churn analysis is the foundation for setting KPIs and achievable targets for your Customer Success team.
2Onboarding is the process through which customers learn to use your service and start to see business value. Customers who successfully onboard adopt your service. Adoption means the customer has incorporated your service into their workflow. Onboarding typically occurs in the first 30 – 90 days of the customer relationship (depending on nature of your service). Best-in-class Customer Success teams constantly strive to shorten the onboarding time as well as the time it takes customer to first see value from the service. Want Advanced Tips? Read TSIA’s blog post – 3 Levels of Customer Adoption Explained
3A health score is comprised of 5 to 8 qualitative and quantitative metrics that measures a customer churn risk (or indicated likelihood to renew). Health scores monitor whether a customer is seeing business value (i.e., service is working) and the strength of relationship. Each customer has a health score. Metrics commonly included in health scores include usage data, satisfaction, support tickets, relationship scores, and customer financial health. Metrics should be leading indicators that are observable and updated at a cadence that allows CSMs to take action. Think of the health score as an early warning system. While the health score is not predictive, it alerts the team to potential risks and helps the team prioritize which accounts to touch and when to touch. Just as the sales executives monitor pipeline, customer success executives track customer health.
4In order to tier customers stack rank current customers based on potential Customer Lifetime Value (CLTV).10 We recommend starting with 3 tiers and tailoring the amount of service you provide based on their CLTV - high touch for high value customers, med touch for mid-value customers and low touch / tech touch for smaller customers). Customer tiering helps team identify most valuable customers, so the Customer Success team can focus resources on these segments.
5Customer journey is the step-by-step description of a customer’s experience from first contact with a company through decision to purchase, integration & implementation, onboarding & education, usage, and renewal & expansion. The journey (often shown as a journey map) is the comprehensive list of all the touchpoints with all parts of the business. In order words, this is the customer’s lifecycle and will be different by customer tier and potentially use-case. To start define the customer journey for the Top Tier (most valuable) clients. Then scale across tiers.
6Customer Success technology stack includes: a Customer Success Management System e.g., Gainsight which is the system of record for the Customer Success team, analytics & reporting products, product telemetry, knowledge management tools, support / help desk, email automation, and other operations technology. A well-functioning CS technology stack enables cross-functional visibility and more real-time and accurate reporting. The result is more meaningful customer interactions and higher retention.
7Gross Retention Rate = Total ARR from existing customers (excludes New logo ARR but includes Upsell ARR) at end of period divided by Total ARR entering period
8Net Retention Rate = Total persisting ARR from existing customers (includes price changes, Cross-sell ARR, Upsell ARR) at end of period divided by Total ARR entering period
9Logo Retention Rate = (# of customers entering period less # of customers who churned during period)/(# of customers entering period)
10Customer Lifetime Value (CLTV) = is the net present value of expected net cash flows over the average customer’s lifetime, less the cost to acquire that customer. The key drivers of LTV are customer retention rate, average net income per customer/user (ANIPU), total CAC, and the discount rate (r in the formula below).