Charlie Gallagher
More By The Author
Back
Sales
Tips for Modeling your Compensation Cost of Sales
Charlie Gallagher | April 05, 2023| 3 min. read

As an organization scales and your coverage model begins to include AEs, AMs, BDRs, SEs, specialists, and leaders, it is more important than ever to understand if your sales team’s cost structure is financially sound.
Read more: Capacity Planning for Sales
A model to forecast your compensation cost of sales
Insight Partners has developed a programmable model to easily forecast your compensation cost of sales. This model allows you to assess the financial impact of different organizational structures and performance scenarios. It also integrates hyper-relevant B2B SaaS benchmarks so you can sense-check your assumptions with what Insight Partners sees across its portfolio of over 500 B2B SaaS companies.
The main output is compensation cost of sales ($ compensation expenses / $ ARR bookings, expressed as a %) — i.e., how much the sales org earns for every $1 of ARR booked. With this measure, you can calibrate your coverage model, check that your incentive structure doesn’t break the P&L, and even use statistical simulations to project the range of cost outcomes.
Further, our model offers increasing levels of sophistication (level 1, level 2, level 3). You can use it regardless of company stage or GTM complexity. Ultimately, it will provide you with the tools and metrics needed to sign off on your organization’s design for the year.
Let’s start with the most basic of models, level 1
Inputs: what you need to plug into the compensation cost of sales model
You’ll need four simple inputs to model your compensation cost of sales.
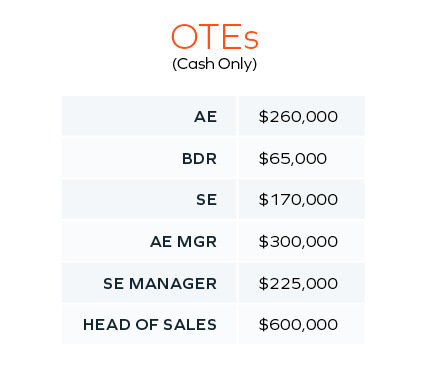
1. On-Target Earnings, or base salary + target incentive, is what reps earn if they hit 100% of their target. OTE excludes payroll taxes, T&E, tools, stock-based comp, and other expenses. Our illustrative example will assume a sales org has the following roles and OTEs.
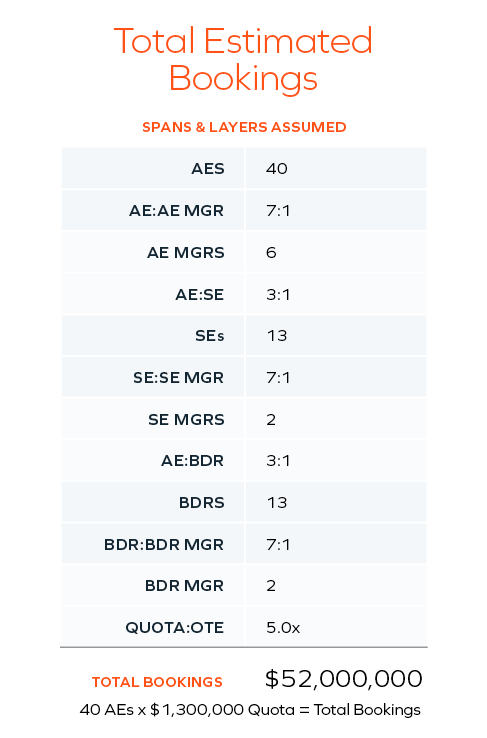
2. AE Headcount is the number of quota-carrying sales reps in that fiscal year. For simplicity, the model does not pro-rate for hire date, ramp, etc. In this example, we have 40 AEs.
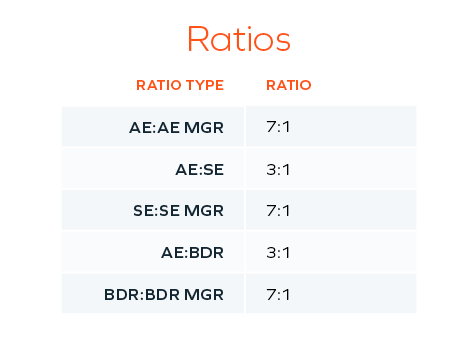
3. Spans and Layers are the ratios you use to determine the Supporting Roles, such as SEs, BDRs, and first-line managers. By plugging in only the number of AEs, the model calculates all supporting roles accordingly. In our example, assume the following:
4. Quota: OTE is the ratio of AE quota to their on-target earnings. Benchmarks are 4.0-5.0x, meaning AEs should carry quotas that are four to five times what they earn if they achieve their quotas. (To contextualize, with a 50/50 pay mix, a 5x ratio implies a 10% base commission rate.) In our example, we’ll set quotas at 5x OTE, so an AE with a $260K OTE carries a $1.3M quota. Note that the quota OTE ratio will vary by selling motion and company stage. Companies with enterprise selling motions and higher ASPs might have ratios as high as 10x, and companies with a nascent selling motion might have 3x ratios as they figure out their product-market fit.
How it works: the mechanics behind the model
Now that we have all our inputs, we can determine how much our org costs relative to bookings.
- Multiply the number of AEs by quota to get total estimated bookings. In our most accessible “Level 1” model, we assume 100% attainment for simplicity.
- Multiply # of each role by OTE to get the total compensation cost of sales ($).
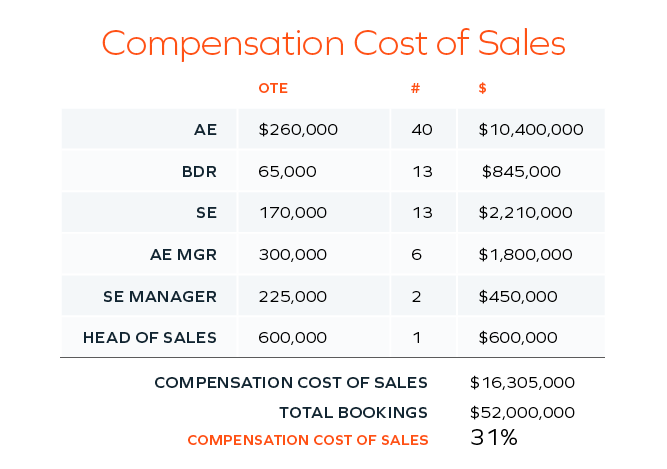
- Divide the total compensation cost of sales by total bookings to get compensation cost of sales (%), expressed as a % of ARR bookings.
This means that for every $1 of ARR booked, your sales organization costs 31 cents. The 31 cents-on-the-dollar-ratio scales as the team grows: every rep hired will book incremental ARR at the same rate that their OTE is added to the overall cost.
Level 1 is a great back-of-the-envelope exercise for organizations of any size but is especially useful for teams with <10 reps. As you scale, consider more sophisticated analyses.
Leveling up: advanced compensation cost of sales (levels 2 and 3)
Level 2 is best for organizations with 10-30 AEs and introduces important nuances like AE and BDR performance distribution: what happens to the cost of sales when overachieving reps earn accelerators, and other reps fall short of bookings quota?
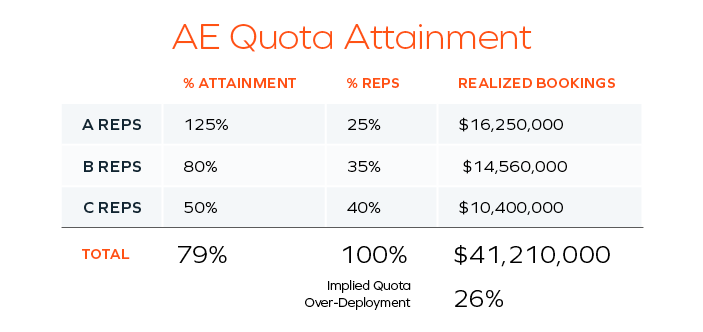
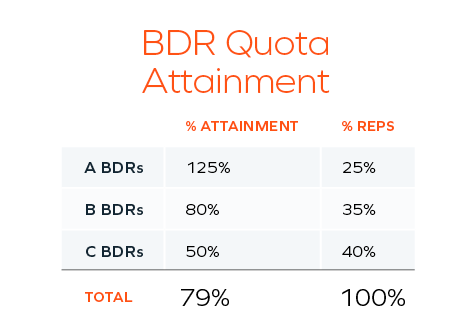
In the example above, one-quarter of reps achieve 125% of quota, 35% of reps achieve 80% of quota, and the rest achieve 50% of quota. Assuming 2x accelerated commission rates above 100%, compensation cost of sales does not scale linearly with bookings. The level 2 model outputs the financial implications of these real-world assumptions.
Level 3 builds on 1 and 2, is suited to organizations with 30+ AEs, and allows you to define average and standard deviation of quota attainment to simulate Compensation Cost of Sales. That way, you can anticipate the range of financial outcomes possible.
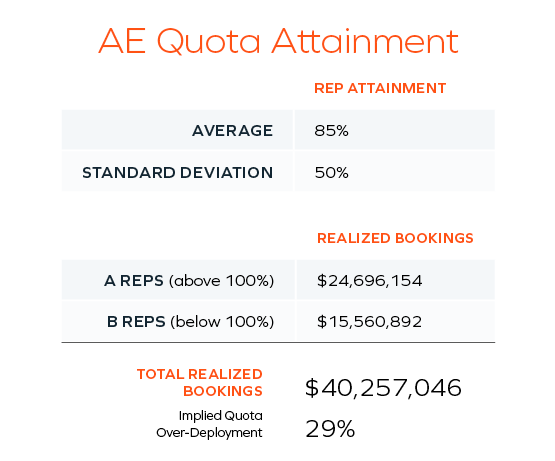
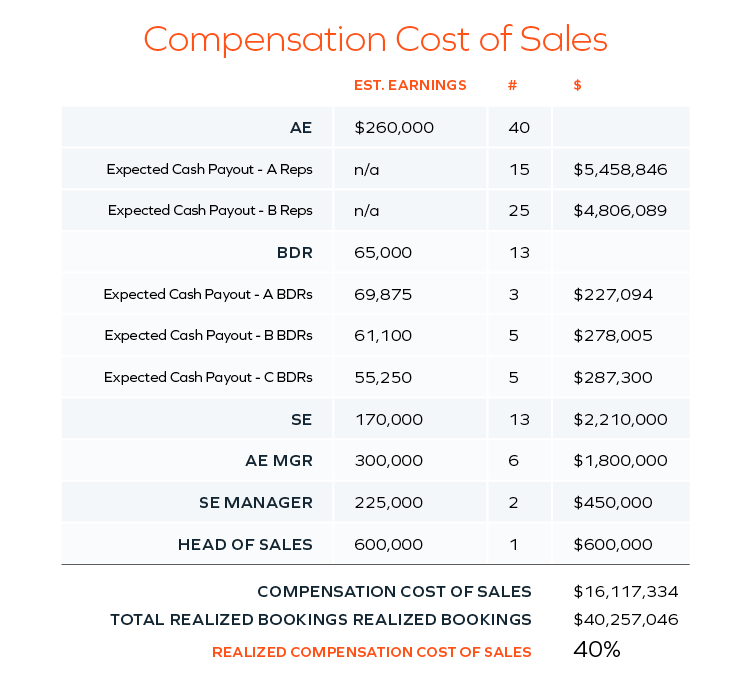
In the example above, you plug in the average attainment of 85% and standard deviation of 50%. The first simulation yields bookings of $40.3M with $16.1M of estimated expenses, leading to a compensation cost of sales of 40%. You can run dozens of simulations to see the range of outcomes.
Why cost of sales is important
Whether you are optimizing for growth or EBIDTA, the sales cost structure represents a “ceiling” on your operating profit: it grows proportionally as the company grows. And sales expense is approximately one-third of total OpEx, so a compensation cost of sales that is high (e.g., 90%) or misaligned to financial objectives can have a big impact.
Compensation cost of sales changes based on your growth rate and as the company scales along its ScaleUp journey. For instance, mature companies growing at, say, 20%, should be more sensitive to compensation cost of sales as opposed to earlier-stage companies experiencing hyper-growth (e.g., 100%+). But regardless of stage and growth, financial discipline is key to investing your capital effectively.
A higher cost of sales may be acceptable in the following scenarios:
- Customer lifetime value (LTV) is high – customers stay for a long period of time and thus the initial cost to acquire them is offset in future years.
- The cost to renew is low – you can pay more to acquire because it’s cheap to renew them (e.g., auto-renewals).
- Complex enterprise sales cycles – requires various overlay roles to help support the selling motion; however, average deal sizes are larger, and contract terms are multi-year.
Conversely, if your cost of sales is high, but you lack these indicators, it’s possible that the economics of your GTM engine are not scalable. There could be a myriad of issues to diagnose, such as poor incentive design, high OTEs, low sales productivity, or suboptimal resource allocation.
Download the model
Sales compensation and quota setting are hard, but by using accessible templates and techniques, it is easy to understand the financial implications of your plan. That way, you can make the best use of your resources and hit the ground running next year.