
Measuring Your Product-Led Growth Strategy
Here in the Onsite team, we regularly get questions about the right metrics and frameworks to focus on when pursuing a Product-Led Growth (PLG) strategy. Fortunately, PLG metrics align mostly to traditional SaaS metrics we all know well. However, there are some nuances in traditional SaaS metrics and emerging new metrics that you should consider for your business as you measure the success of your strategy. Without a thorough understanding of where and what to optimize throughout the customer journey, you may not get the impactful results that PLG can deliver. If you have a PLG strategy with established metrics for your product today, this review will help you assess how you can improve it even further.
Traditional SaaS Metrics Aren’t Enough
With any strategy, you need to be data-driven. However, this is even more important as you use your product as an active element of your Go-to-Market motion. If you aren’t laser-focused on being data-driven throughout every stage of the customer journey, learning-cycle times will increase, opportunity costs will rise, and you won’t be able to capitalize fast enough on your target market.
Most of us are familiar with the Pirate Metrics Framework (AARRR) from David McClure shown below. This framework (cue pirate voice – AARRR!) is widely accepted as defining the five most important metrics for a startup to focus on – combining simplicity and the ability to measure growth effectively.
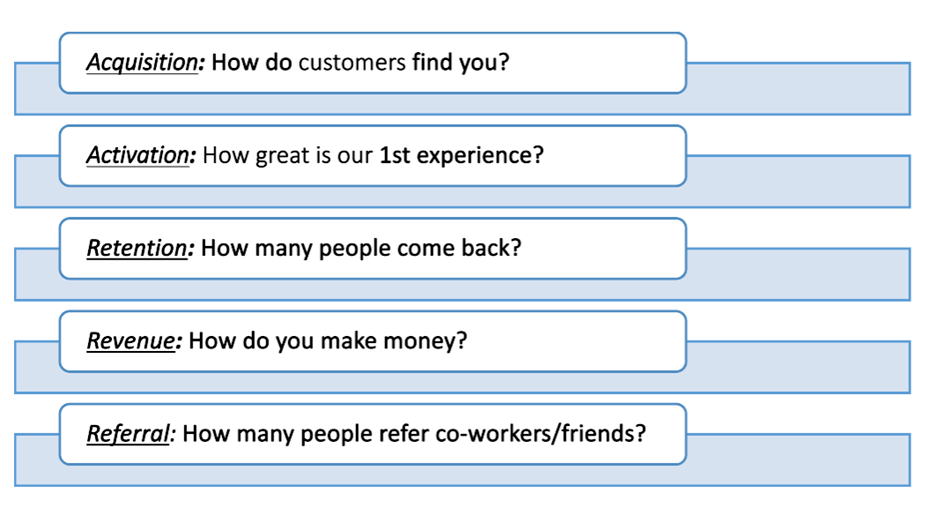
Applying this framework to a PLG strategy, we see familiar metrics that are important no matter what Go-To-Market strategy we are pursuing.
- Acquisition – Signups and Qualified Leads
- Activation – Activation Rates and Daily/Weekly/Monthly Active Users
- Retention – Customer Churn and Revenue Churn
- Referral – Conversions through referrals and % of Customers who become referrers
- Revenue – Annual/Monthly Recurring Revenue and Average Revenue Per User/Customer
Additionally, we see some “traditional” SaaS metrics become less of a focus in a PLG environment.
- Customer Acquisition Cost (CAC) – Companies must invest heavily in R&D for customer acquisition and conversion, which traditional CAC calculations don’t capture. CAC payback may appear artificially low.
- Growth Rates – PLG companies often grow slower at first before exceeding non-PLG peers, given more scalable PLG sales and upsell motions.
- Logo Retention – This is less applicable to an end-user focused adoption model since multiple end-users are making independent adoption, expansion, and churn decisions
We also see new metrics emerging or being given renewed focus to assess the growth and health of PLG environments.
- Natural Rate of Growth (NRG) – OpenView developed this metric to track how fast a company grows before investing in traditional sales & marketing.
- Return On Incremental Invested Capital (ROIIC) – This metric represents a way of understanding payback of incremental growth investments across sales, marketing, and product.
- ARR return on cash burn – This metric represents the amount of incremental ARR generated for every $1 burned.
- Free to Paid Conversion Rates – This metric will represent conversions from either a free trial with or without a credit card or a freemium product. A “good” conversion rate is one that is always improving. Ada Chen Rekhi details this well in her blog post citing the many studies that have been done on this metric over the years.
As you can see, in a PLG environment the metrics landscape shifts from what we know from the world of the traditional SaaS subscription playbook. PLG metrics frameworks will continue to evolve as businesses refine their PLG strategy. Bottom line, traditional SaaS metrics aren't enough to know the health of your PLG strategy.
Understanding Metrics in a Product Led Strategy
In Jim Collins’ book Good to Great, he talks about the Flywheel effect.
“In building a great company or social sector enterprise, there is no single defining action, no grand program, no one killer innovation, no solitary lucky break, no miracle moment. Rather, the process resembles relentlessly pushing a giant, heavy flywheel, turn upon turn, building momentum until a point of breakthrough, and beyond.”
That sums up the PLG promise. It’s hard. It takes cross-functional teams across R&D and Go-To-Market to work tirelessly and run hundreds of experiments to learn where the tailwinds are in order to get to the next level of growth. Focusing on the customer journey is essential. The flywheel graphic is a great way to visualize your customer journey and map out your metrics. Each outcome from the previous step should create momentum for the next step in the journey, thus creating the flywheel effect. Here is how we think of the customer journey:
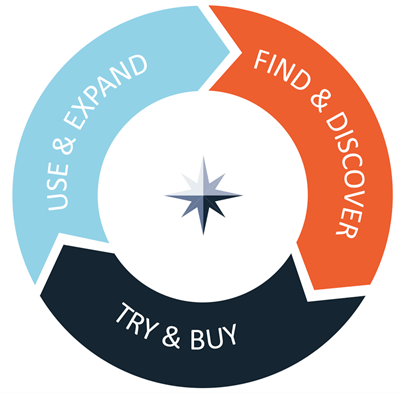
Our simple flywheel summarizes in 3 steps that describe the customer journey a customer will go through when engaging with and purchasing your product.
- Find & Discover – Allowing effective organic growth by allowing customers to organically find, discover, and test out your product before purchasing. This can also include viewing or participating in how the community of other users gets value from the product. The community of users can be a powerful selling point or reason for conversion.
- Try & Buy – Enabling customers to more efficiently buy your product and upsell to additional features and functionality.
- Use & Expand – Ensuring that customers continue subscribing and grow their spending over time.
By understanding the journey, you can now start to layer metrics that measure those key steps in the journey.
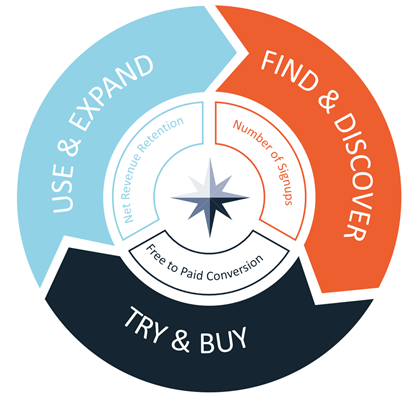
Throughout the customer journey, there will be key measures of success that you should optimize for by aligning around a North Star metric associated with the phases of the customer journey.
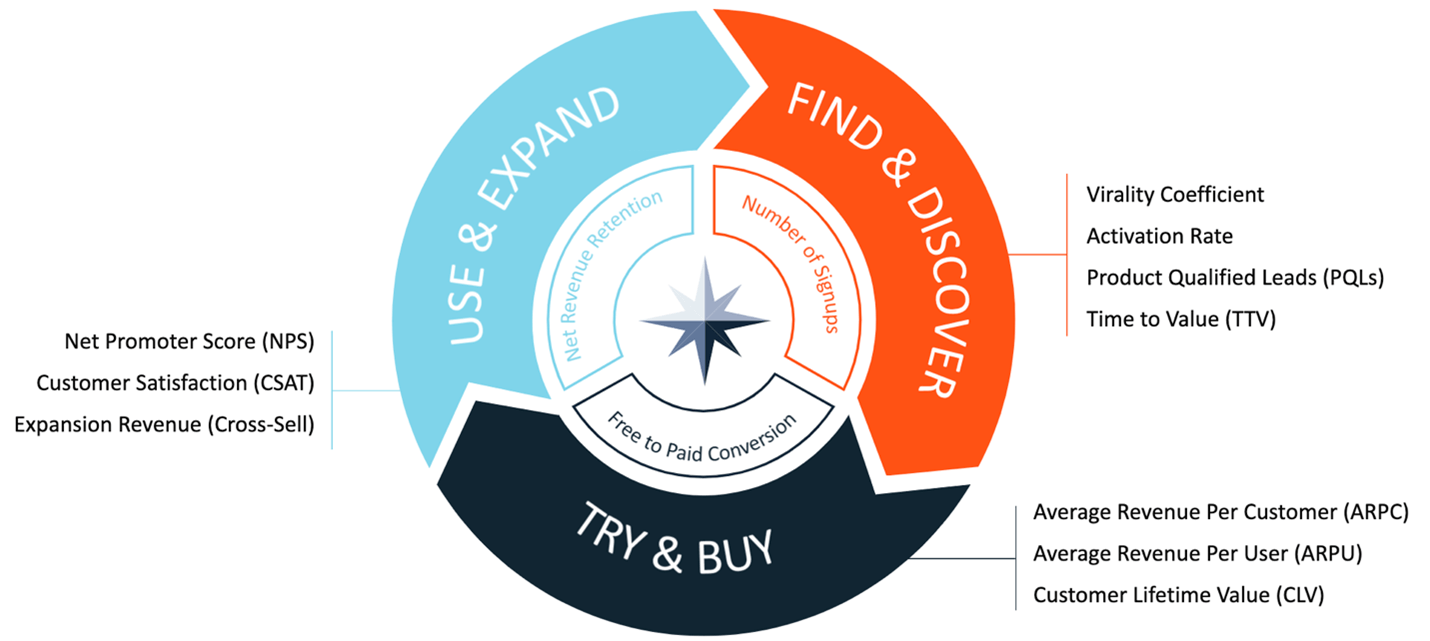
Optimize means getting the necessary resources aligned across the organization to move that north star metric within each phase of the customer journey. For example, “Signups” in the “Find & Discover” step is a metric that can be used to see if your inbound and outbound marketing efforts are working. An alternative North Star metric could be “Activation Rate.” This metric shows how quickly and effectively your new users are achieving perceived value. The goal with the North Star metrics is to ensure we are aligned across the company to optimize growth. Other important metrics throughout the customer journey that you should consider tracking in conjunction with your North Star metrics are as follows:
- Time To Value (TTV) – Time it takes for new users to reach their “aha moment” or activation event and realize value. Calculated by taking the average number of hours / days to reach a key activation event.
- Virality – Number of new users that each existing user can successfully convert. Calculated by the number of invitations sent by each customer x the % conversion rate of each invite.
- Product Qualified Leads (PQLs) – Leads who have already experienced the product’s value. Usually calculated based on the engagement score.
- Free-to-Paid Conversion Rate – Percent of users that go from a free product to a paying customer. Calculated by number of customers who become paying customers / number of customers trialing or using free version.
- Expansion Revenue – Revenue from existing users being cross-sold/upsold. Calculated by MRR / ARR from existing customers through upsell/cross-sell.
- Average Revenue Per Customer/User (ARPU/ARPC) – Revenue you can expect to make from an individual user. Calculated by ARR or MRR/# of customers.
- Net Revenue Churn – Money lost after accounting for new and expansion revenue. Calculated by Revenue lost in period – new and expansion revenue / revenue at beginning of period.
- Customer Satisfaction/Net Promoter Score – Gives insight into % of active users having a positive experience. Calculated by # of positive user survey responses / total responses or traditional NPS calculation.
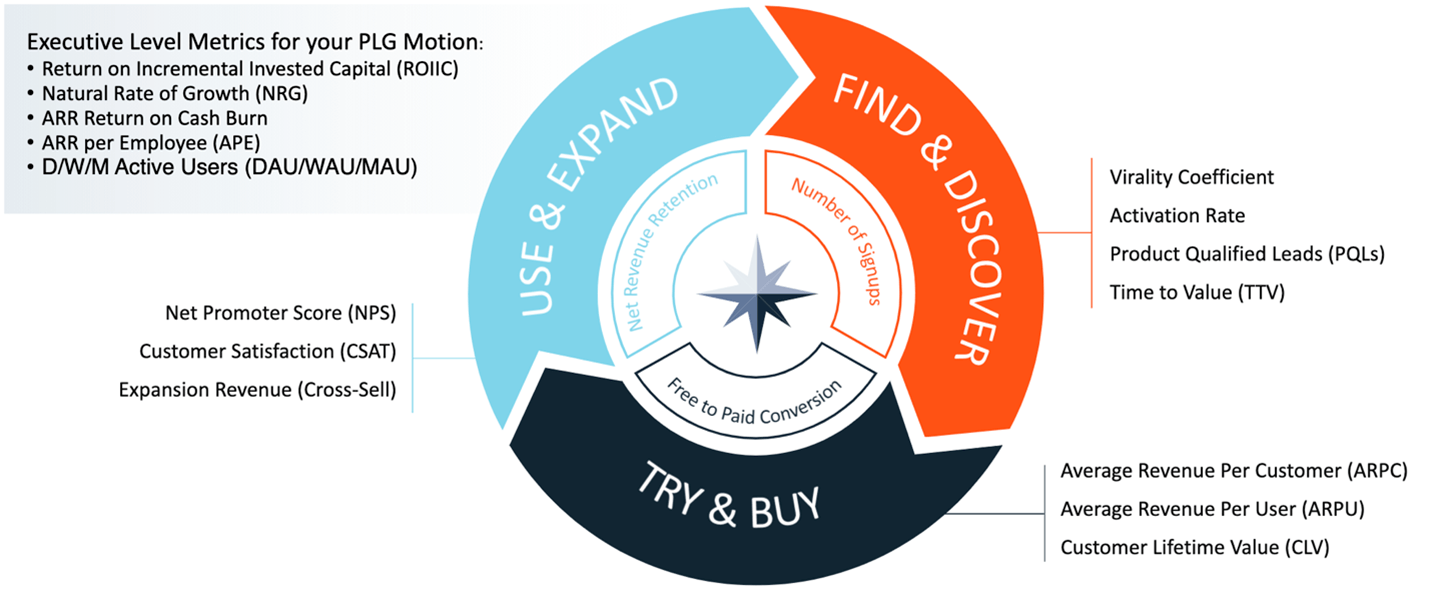
Now let’s zoom out of the journey view and think about what matters from the top level around the health of your PLG strategy. Here are a few metrics that you should consider:
- Natural Rate of Growth – How fast a company grows without even trying, before layering on sales & marketing. Calculated by 100 x (annual growth rate x % organic signups x % ARR that starts in product).
- ARR return on cash burn – Represents amount of incremental ARR generated for every $1 burned. Calculated by New ARR / cash burned.
- ARR per employee (APE) – Represents amount of incremental ARR generated for every employee. Calculated by ARR / number of employees.
- Daily/Weekly/Monthly Average Users (D/W/MAU) – Number of users that are active in the product for any given time period. Calculated by unique user logins into your application over a time period.
- Return on Incremental Invested Capital (ROIIC) – Metric on understanding payback of incremental growth investments across sales, marketing, and product. Calculated by (Gross profit – G&A expense) / (sales, marketing, product, and engineering expense).
Is Another Framework Worth It?
The wise folks at OpenView, Battery Ventures, and the Product Led Growth Collective have written extensively about PLG metrics. We understand breakthroughs don’t come from applying an out-of-the-box framework to your situation without understanding your context deeply. Frameworks allow us to share our mental models, have a conversation, and get us into the same thinking space. We might say metrics while you say KPIs. The broad descriptions don’t matter. What does matter is how you can take what resonates with you and apply that to your context to improve your strategy.
Metrics alone won’t get you results. You need to be iterative and human-driven through all stages of the customer journey to understand where your product is and where the market is pulling you next. So, take an inventory of the metrics you are tracking across your PLG strategy and map those to the customer journey. Then ask yourself and/or your teams: Are we aligned and optimizing for the right metrics for our strategy? We think this exercise will help you understand your customer journey more deeply and focus on the right growth metrics needed for your next stage of growth.
Last, we are preparing to kick off our PLG metrics and trends project across technology companies. Our goal is to compile, benchmark, and share trends we are seeing around how companies are measuring their PLG Strategy. To participate or get more information, please reach out to the Product and Technology COE at PLG@insightpartners.com.
Product-Led Growth: The New Paradigm in Software Selling
READ