Quantity vs. Quality: Should We Lower Our Lead Score Threshold in Order to Send More MQLs to AEs?

Lead scoring is a critical tool for scaling companies of all sizes to ensure efficient funnel performance. However, lead scoring should never be set it and forget it since it is a key component of funnel health. We encourage Insight Partners portfolio companies to establish a lead scoring council, co-owned by sales and marketing, with customer success and, for those with product-led growth (PLG) motions, Product. This lead scoring council should meet at a minimum quarterly to assess business performance and stress test the model to ensure that lead scoring is calibrated based on maximizing lifetime value. This is critical to ensure that sales and marketing are efficiently converting prospects that create sustainable lifetime value for the business.
The leadership at one of our portfolio companies recently asked, “Should we relax our inbound lead score threshold in order to send more MQLs to our AEs?” There are several situations in which this is most relevant:
- The company wants more at-bats as it recently went on a hiring spree for both SDR/BDR and AEs
- The company is actively launching new products, testing new markets and/or segments where they don’t have historical data and need to gain traction
- The company is investing in more top of funnel, with lower MQL rates, but steady opportunity generation and win rates, so the company can test the waters to drive additional pipeline generation
To decide whether this is the right path for your company, there are relationships between variables to consider: lead quality to win rate, and capacity to sales effort. While we are proposing a quantitative approach to answering this question, you will want to make sure you collect qualitative feedback from the go-to-market (GTM) team to validate that this is the best path forward.
Lead quality to win rate
To begin, consider that the win rate improves with lead quality as illustrated in Figure 1. For very poor lead quality, the win rate is nearly zero. At some point, the win rate improves rapidly. Ultimately, the win rate slows and saturates due to diminishing marginal returns on lead quality; even CxOs who submit demo requests will not close at 100%.
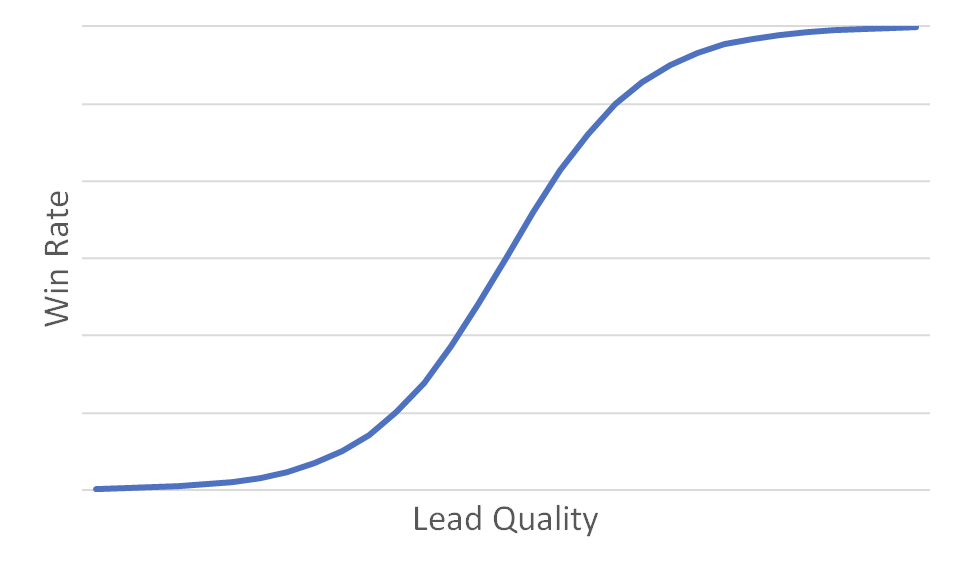
If the company doesn’t have strong analytical talent, it can identify the optimal trade-off of lead quality to win rate by testing a “null hypothesis”. The “null hypothesis” method would be to leverage A/B testing and a best guess for volume increase: Increase the leads for a particular territory while keeping the other territory constant. Measure the win rate impact and compare. Other measurements to validate lead quality are: the conversion rate of leads to pipeline, average sales cycle, and ACV. For more precision on what point on the “S” curve is most optimal, we use math!
Since the math can get a bit tricky with the curve in Figure 1, we can use a piecewise linear estimate to approximate the relationship between win rate and lead quality. In Figure 2, the win rate increases in steps from w3 to w2 to w1. A good way to think of this is that each step represents a different combination of lead source (demo request vs. content download), persona (VP vs. Director), and overall engagement (repeat- vs. first-time visitor).
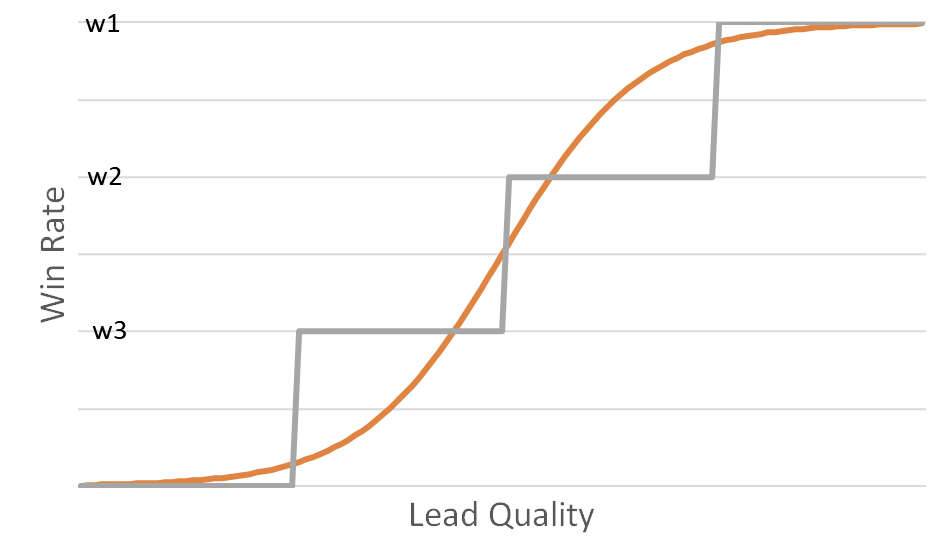
Imagine a company only serves AEs a quantity of leads (L1) of the highest quality (w1) with a fixed average annual recurring revenue (ARR) for closed won deals (A). Then, the total ARR booked is:
𝐴∗𝑤1∗𝐿1
Now, assume the company relaxes the inbound lead score threshold and allows some quantity (L2) of leads to flow to reps with the next tier of quality (w2). Though the win rate is lower, let’s assume the average ARR is still A.
We need to add two practical complications since salespeople have limits on sales effort and capacity.
Sales effort to capacity
Turning up the volume on lead gen is great as long as the company has the capacity to execute. If the pipeline exceeds its ability to execute, the company is then faced with aging leads and deals, over-whelmed sellers, wasted marketing funds, and potentially dissatisfied buyers.
When testing the influx of leads in the test territory (as mentioned in the “null hypothesis” above), capturing the # of leads and opportunities worked by a rep will help with calculating a rep’s workload. Does the lead and opportunity influx result in greater booking and personal attainment? Simple pattern analysis may work if the company is testing for smaller teams.
It is important to understand how sales effort or “energy” is factored in calculating capacity to execute. The first complication is that handling L2 additional opportunities may lower the win rate on the L1 leads from w1 to (w1 – e). We will refer to ‘e’ as the energy factor since doing more in the same amount of time typically results in lower performance.
The second complication is that reps may have an upper bound to the number of opportunities they can handle. By adding L2 leads, the number of leads the rep can handle may drop from L1 to (L1 – c * L2). Here, c is a capacity factor.
Putting everything together, the company should let through some amount of lower quality leads if doing so will result in increased overall bookings. This can be expressed as:
𝐴 (𝑤1∗𝐿1)≤𝐴[(𝑤1−𝑒)(𝐿1−𝑐∗𝐿2)+(𝑤2∗𝐿2)]
In our experience, AEs are more energy limited than capacity limited. Setting ‘c’ to zero and solving for the energy factor, we find:
𝑒 ≤ 𝑤2(𝐿2/𝐿1)
In words, we can feed reps lower scoring leads if the reduction in the win rate (e) of the original higher quality is less than the win rate of the lower quality leads (w2) times the ratio of the lower quality leads (L2) to the original higher quality leads (L1).
Example scenarios
By way of example, assume AEs normally get 50 leads per quarter (L1) with a win rate of 30% (w1). Now, we’d like to send reps 10 additional leads per quarter (L2) but these leads have an expected win rate of 20% (w2). We should do so if we can expect the win rate on the original leads to drop by no more than 4% (from 30% to 26%):
𝑒 ≤ 0.2(10/50)
𝑒 ≤4%
It is hard to know in advance exactly how large the adverse impact will be on the original win rate. However, we encourage companies to pilot (A/B test) this to determine the actual impact on rep productivity.
Notably, our example assumed that the quality was relatively high for the additional (L2) leads. If the L1 leads are VPs with inbound demo requests and the L2 leads are Directors from the same source, then this is a safe assumption. However, if the L2 leads are demo requests from Managers or even prospects who attended thought-leadership webinars or downloaded content, then w2 would be much lower. As w2 goes down, e goes down which means that we would not tolerate even a small negative impact on the win rate (w1) of the high-quality leads.
Beyond rep energy and capacity, we also need to consider the overall economics of the business under the assumption that reps should at least be able to achieve quota. To explore this, let’s assume we are thinking about hiring an incremental AE to exclusively handle the Tier 2 (w2) leads instead of sending these leads to the existing reps.
Continuing our prior example, AEs win 60 deals per year given 200 leads and a win rate of 30%. These are typical numbers for SMB so let’s further assume a deal size of $12.5K which yields bookings of $750K per year. Assuming a 5x quota:on-target-earnings (OTE) ratio, their compensation is $150K. Notably, the 5x quota:OTE ratio is the key link to the economics of the business since the percentage of bookings paid to AEs is usually the largest component of customer acquisition cost (CAC) which in turn directly impacts cash flow and profit.
Applying the same math with a 20% win rate, bookings would be $500K and OTE would be $100K. With current B2B OTEs for entry-level AEs starting at $120K, hiring reps to pursue the lower-quality leads in this example does not seem feasible.
Always test before “going live”
As we explored, the decision on whether to lower the lead score threshold in order to provide additional opportunities to reps depends on energy for a closed won, and capacity, as well as the practical economics of the business. Regardless of whether a company leverages math or simply tests in real-time, it boils down to relationships between win rate, lead quantity, and average ARR. Companies should always pilot (A/B test) rather than go full scale should they wish to explore the economic impact of (slightly) lower quality lead sources with the caveat that the lowest quality leads, content downloads, for example, are almost never worth pursuing and should instead be nurtured via marketing automation to ensure it passes the quality threshold. As long as leaders across the organizations accept that funnel performance may decline, and there is a clear process in place to measure the fluctuations, then companies should regularly look to always test the limits of their lead scoring model.
Explore the SaaS Growth Acceleration Framework
Explore this topic and 40+ other critical business considerations in our interactive SaaS Growth Acceleration Framework for founders and GTM leaders.
Here’s how SaaS leaders ($10m + ARR) can use this framework to win:
- Understand the downstream implications of 40+ critical business decisions
- View how product-related decisions can shake the foundation of your go-to-market strategy
- Dig deeper into any GTM component to view key questions you should be asking when making changes

