Matthew Harper
More By The Author
It is likely that you or someone you know has a new puppy. Since the start of COVID, puppies have been in high demand because of their companionship and general life enrichment. We know that puppies are cute and fun, but their needs change as they grow and mature, and we need to look at them differently when they are adult dogs compared to how we look at them when they are energetic pups.
The same applies to startup companies transitioning to the ScaleUp stage; they aren’t the same at $5M as they are at $20M, $50M or $100M. This also translates to the method that we use to measure and assess companies - Key Performance Indicators (KPIs). We should not assume that all software companies need to achieve the same performance across all KPIs as they grow.
At Insight Partners we believe that there are a handful of KPIs that should be considered by all ScaleUps, and that the benchmarks need to change as companies evolve. For example, CAC (customer acquisition cost) Payback Period can’t be the same for a company that’s beginning to scale and is investing heavily in marketing and sales headcount, as it is for an older company with infrastructure in place that is reaping the rewards of prior investments in team, brand, and product. Because of this disparity, each year our Sales and CS Center of Excellence collects data and metrics from our portfolio companies and publishes our SaaS Sales & CS KPI Benchmark Report.
Insight Partners’ Sales and CS Center of Excellence helps the companies we’ve invested in – our portfolio companies – improve their go-to-market capability to support fast and efficient scaling. Across the portfolio, we’ve established a uniform set of KPIs that we use to diagnose scaling challenges and deliver tailored and actionable insights. One of the most common requests from sales leaders is for reliable and relevant benchmarks to help them understand how their performance compares to companies of similar size, stage, go-to-market motion, geography and vertical.
Our data from 200+ active SaaS portfolio companies and over 25 years of investing in B2B SaaS technology affords us the most comprehensive and relevant benchmarks related to growth, sales efficiency, sales productivity, and customer retention/churn. We provide these insights to our portfolio with tailored statements, webinars, our Periodic Table of SaaS Sales Metrics, and an annual SaaS KPI benchmarking report. This is a powerful tool for ScaleUp leaders to use as they build their organizations.
Although our report analyzes 45 sales KPIs, this blog examines one metric from three of the core categories – Sales Efficiency, Sales Productivity and Go-to-Market (GTM) Strategy. We give you a taste of the insights derived from our data and examine how these benchmarks change as companies evolve from being puppies to full grown dogs.
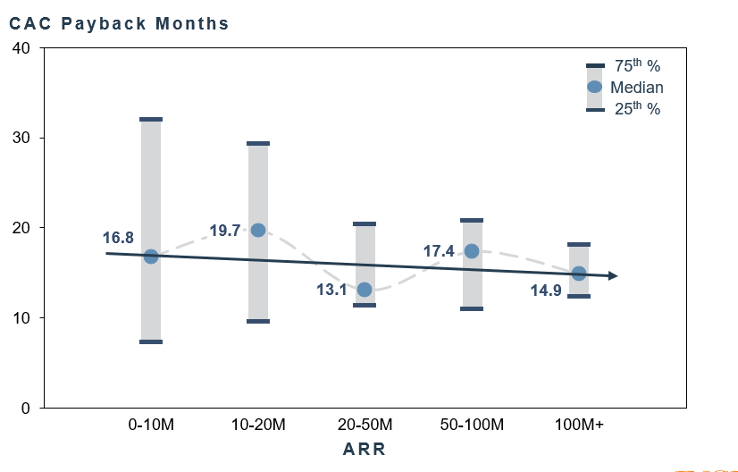
Sales Efficiency: Customer Acquisition Cost (CAC) Payback Months
CAC payback months – the number of months of revenue it takes after acquiring a customer to recoup the investment – is a crucial indicator of sales efficiency and one of the most common metrics that venture capital firms evaluate. The industry target is 12 months or fewer to see a return on the investment. We see differences in the benchmarks over time and suggest that while companies should strive to achieve 12 months, they should compare themselves against the relevant benchmark for their stage of growth and selling motion.
Early stage startups and ScaleUps are typically investing heavily in sales headcount, systems, enablement, and marketing to drive high levels of sales growth and capture market share. This drives up the cost of acquisition and inflates the CAC Payback period. We see early stage companies (<20M ARR) averaging ~17 months payback.
As companies continue to scale, they begin to see increases in customer lifetime value and stronger net retention. They also shift into a more repeatable sales motion along with expansion sales and are able to optimize their sales efforts to drive lower payback periods.
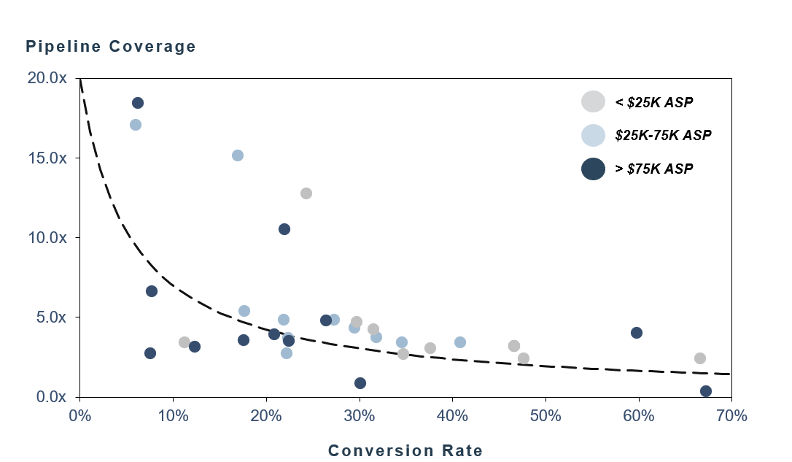
Sales Productivity: Pipeline Coverage
Sales Pipeline coverage is one of the few metrics where we don’t see much variance based on the stage of a company. To assess the health of the sales pipeline, companies should look to their historic win/loss data to determine the ideal pipeline coverage ratio; the minimum expected coverage ratio is the inverse of a company’s historic conversion rate. For example, a company with a consistent win rate of 25% should build a pipeline of 4x. The amount of pipeline needed will also vary by sales rep depending on their personal win rate and the sales cycle of their deals. As companies evolve and sales teams get more experience, win rates can increase, requiring lower pipeline coverage at the start of any quarter.
In the graph below you will note that companies with larger average sales prices (ASP) have longer sales cycles, making it difficult to add and close deals within the quarter, and hence they need higher pipeline coverage. Additionally, high ASP companies tend to see deals slip out of the forecast more often, a further reason for sales teams to have excess pipeline to achieve their targets.
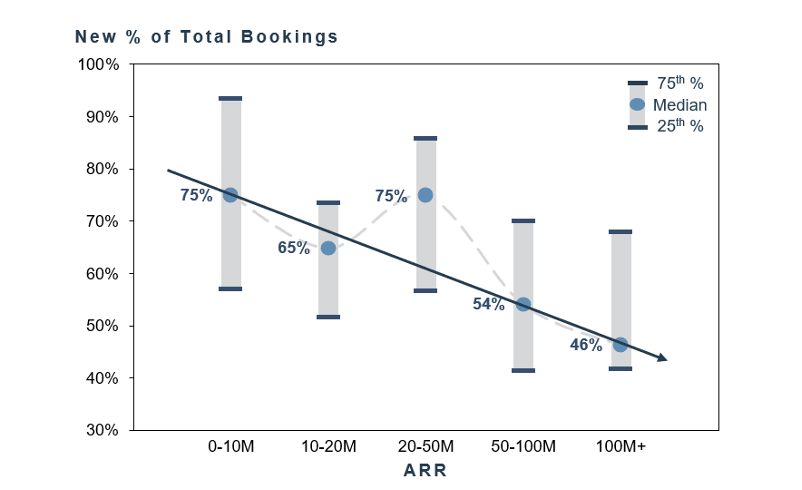
GTM Strategy: New Bookings as a Percentage of Total Bookings
New Bookings as a percentage of Total Bookings provides a glimpse into the impact of new sales on the company. Early stage companies, hyper focused on growth, are primarily concerned with acquiring new customers and honing their ideal customer profile. In building a customer base foundation, expansion sales often take a “back seat.” As companies mature, expansion becomes critical to healthy growth; the expansion and retention of existing customers is the lifeblood of more mature companies. This means that new logos as a percentage of total bookings decreases with company size, which is the result of the customer base becoming larger year-over-year.
The above three metrics remain constant and critical (CAC Payback, Pipeline Coverage, and Bookings Mix) with the benchmarks shifting as companies evolve and move along the ScaleUp curve.
Back to our puppies. As they age, their nutritional needs change as do their sleeping patterns, even though some things stay constant, like the need for exercise and attention. We need to adjust our expectations as things evolve and we need to stay focused on core KPIs. By doing so, we can ensure that a ScaleUp matures into a healthy, stable company with strong long-term potential.
Our final bit of advice: if all this talk about metrics has stressed you out, if your CAC Payback Period is way longer than the benchmark or if your pipeline coverage isn’t high enough, take a moment and go hug a puppy. It’ll make you feel better. If you’re a member of Insight portfolio, call Insight’s Sales & CS Center of Excellence, or your investment partner to get a copy of the full Sales KPI Benchmarking report tailored to your needs.