As part of the Onsite team here at Insight, we have hundreds of conversations with portfolio company leaders each year. One of the most common questions we get is, “How much should I spend on marketing?” To answer this question, we analyze marketing spend and performance data from our portfolio of 500+ B2B SaaS companies annually. Importantly, we layer context on top of the insights we gather from our daily conversations. The objective is to help companies better plan to achieve their goals and gain perspective on their performance throughout the year.
While our last publicly released report was in 2022, at the end of 2023 we released a private report for our portfolio companies using the same methodology as the 2022 report and provided guidance in our advisory, some of which we’ll detail below. Given the economic downturn and changing funding environment, we advised portfolio companies to:
- Eliminate waste, but keep testing to identify opportunities for efficient growth: be agile.
- Up-level strategy and execution: right people, right message, right time.
- Look to existing customers for efficient growth: retain and expand; don’t just land.
As we enter 2024, we’ve analyzed and reflected on what happened in 2023 to help companies better prepare. Below are our top three trends and advice for the year ahead.
Trend 1: Slowdown in new business growth and increasing cost to acquire
Growth slowed, with deals becoming harder (and more costly) to close.
Like most SaaS scaleups, our portfolio companies experienced a slowdown in new business growth as budgets for new software purchases continued to get squeezed. From our conversations and from looking at sales velocity and conversion data, deals were getting stuck in the sales process and becoming harder to close.
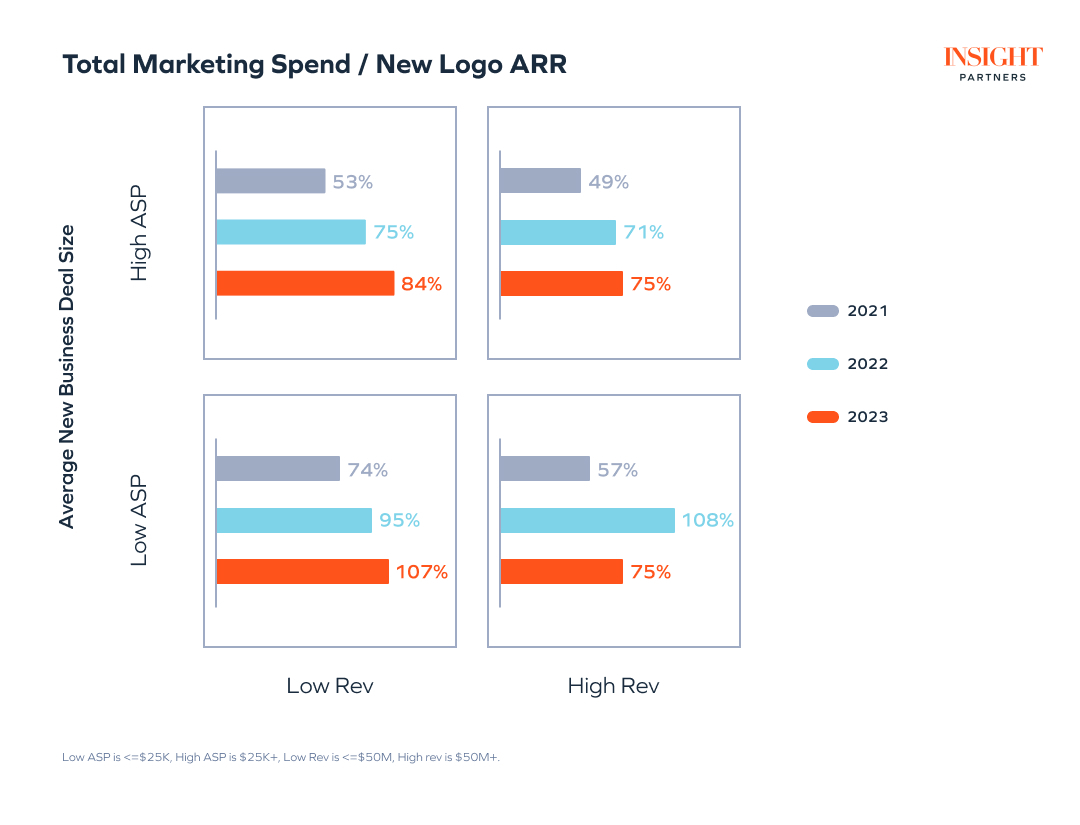
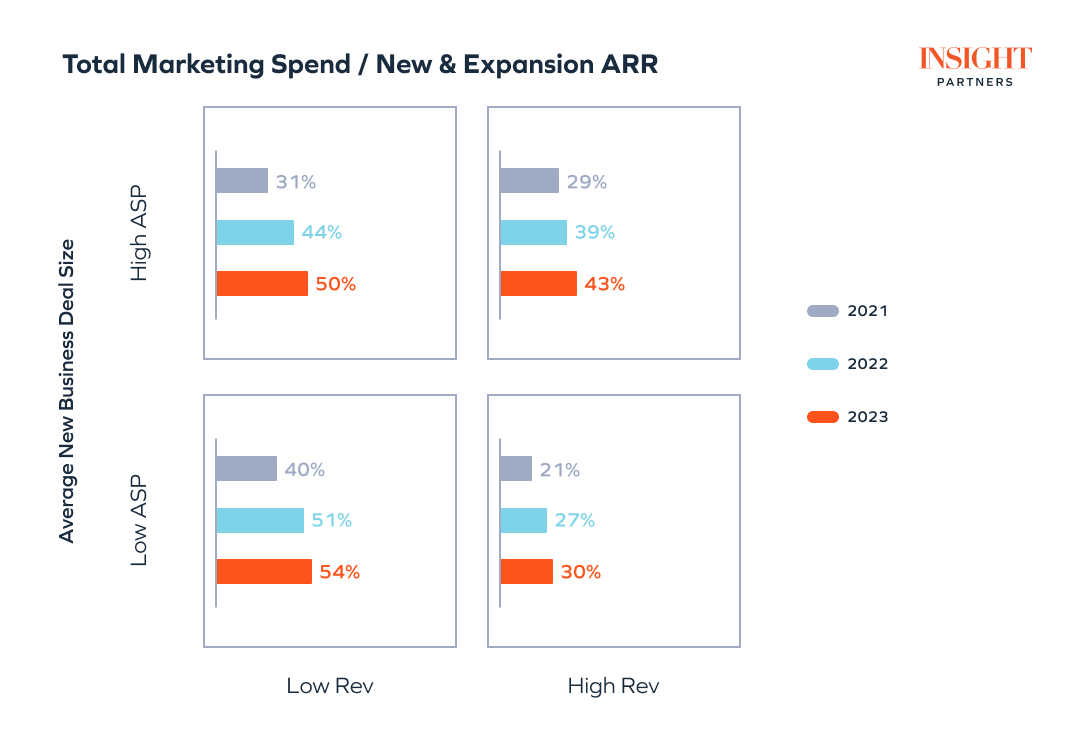
This slowdown in new business was a driving factor behind rising marketing inefficiency, as measured by the amount of marketing dollars needed to generate a dollar in new business ARR (i.e., total marketing spend / new logo ARR). This metric has continued to rise for the past three years, with our earlier-stage companies being the hardest hit. Companies at this stage are often still iterating on their best-fit customers, priority use cases, and messaging — not to mention building out their demand gen engines and sales processes. This makes it harder for them to target the right people with the right message at the right time, a necessity during times of tighter software budgets.
Trend 2: More measured marketing spend and reprioritization
Marketing spend was up, but more modestly and shifted away from new business demand generation.
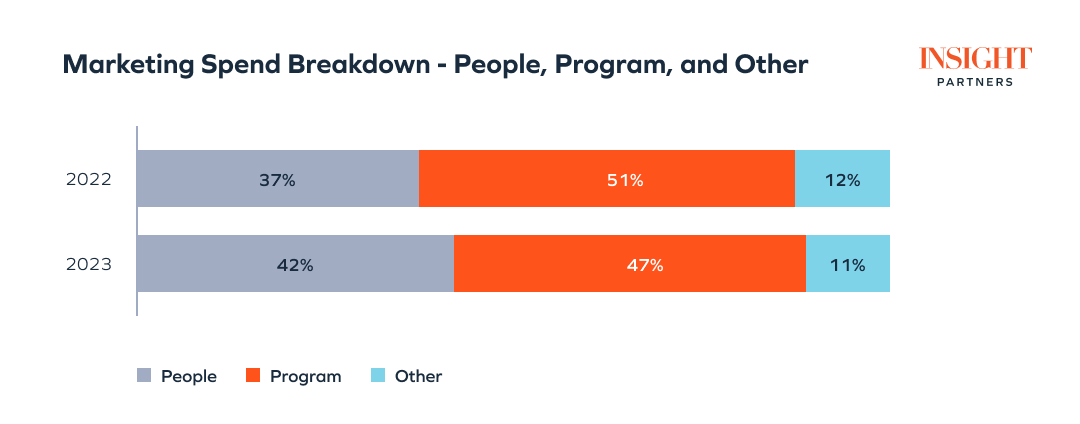
While total marketing spend still rose by 14% year-on-year (YoY), this was a significant departure from the 79% growth we saw the prior year. Spend has also shifted away from program spend, which is primarily used to drive new business acquisition. Program spend saw a YoY uptick of only 8%, causing its share of the total marketing budget to drop from 51% to 47%. This reflects a shift in marketing and company priorities towards driving more efficient growth.
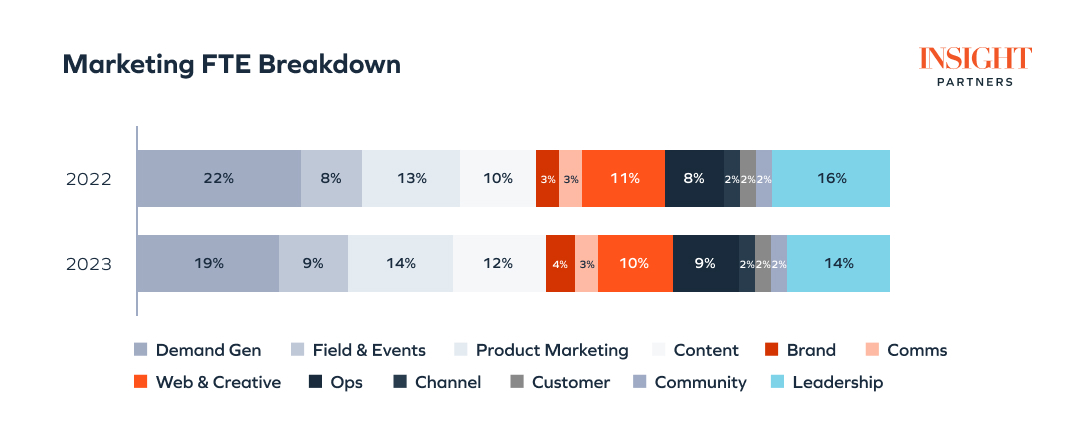
Also telling is that even though companies were hiring in marketing, we saw demand gen headcount drop from 22% to 19% of overall marketing headcount. This headcount was shifted to roles supporting strategy and driving targeted, relevant engagement throughout the funnel.
Through our conversations with portfolio leaders, we heard from many about the need to get laser-focused on engaging their best-fit buyers with refined messaging tied to their priority pain points. They also needed more targeted and relevant content to keep buyers moving through the funnel, not to mention content to drive organic leads and SEO in a quest for more efficiency. Taken together, this drove headcount for product marketing, brand, and content to 30% of overall marketing headcount, up from 26% the year prior.
Companies are looking beyond just closing new business, and they are prioritizing lifetime value.
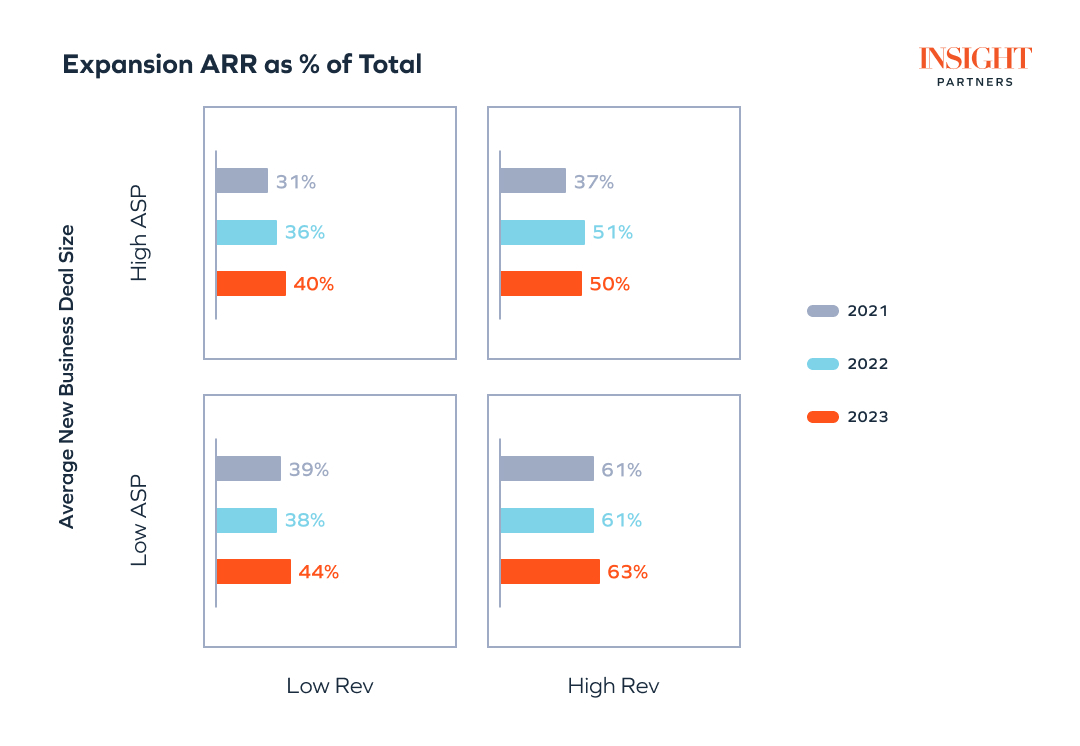
While startup and ScaleUp marketing teams have historically focused on landing new business ARR, we started seeing an increased focus on existing customers during COVID-19 as a more efficient way to drive growth. When looking at expansion ARR as a percent of total new and expansion ARR, this rose to 48% this past year, up from 44% and 35% in the two years prior. The increase was most significant in companies with average sales prices (ASPs) under $5,000, which saw their expansion percentage climb from 47% to 53%.
These are mostly product-led growth (PLG) companies who, rather than just focus on the land as they did in years past, became more deliberate about owning and expanding in the accounts post-land. This is also more evident among our early stage companies. We saw their expansion percentage continue to increase compared to our later-stage companies who tapped into that playbook the year prior. There is also only so much expanding a company can do — ultimately, ScaleUps need to continue to focus on driving new business growth to hit targets.
A related trend we’re also starting to see is an increased sophistication in how B2B marketing teams think about who they target and how much to spend. The least sophisticated marketers are focused on the volume of leads and cost per lead (CPL), while historically, the more sophisticated marketers would look further down the funnel at pipeline and closed-won metrics (e.g., cost per marketing-sourced pipeline dollar or an ROI on marketing spend). What we’re seeing now from the most sophisticated marketers is that they’re taking a page from our friends in B2C and balancing acquisition cost with lifetime value (e.g., LTV to CAC). This is echoed in an increased focus on identifying and targeting best-fit customers who are more likely to renew and expand. More on this below as we talk about our advice for 2024.
Trend 3: High performers found a path to outsized, efficient growth
While companies faced a challenging environment last year on the whole, there are bright spots throughout the portfolio where we saw examples of great execution and success. These higher performers are companies in our portfolio that are above average in three key metrics:
- ARR Growth
- Net Revenue Retention
- CAC Payback.
While overall conversions and efficiency suffered, high performers bucked the trend.
The goal of driving higher conversions and operational efficiencies yielded mixed results in 2023. On average, we saw the marketing qualified lead (MQL) to closed-won conversion rate drop across the portfolio, but our high-performing companies bucked the trend.
High performers with an ASP below $25,000 increased their conversion rates, with MQL to closed-won rates increasing by 82% (note: this is an increase in the conversion rate, not the conversion rate — e.g., increasing by 100% would mean conversion rates doubled). These companies were already invested in relevant messaging and content and had the resources in place to lean in here with a more full-funnel approach. Their headcount for product marketing, brand, and content was at 33% of the total in both 2022 and 2023, which was higher than the 26% and 30% that we saw across the full sample. While they didn’t see improved efficiencies in their marketing spend versus new business ARR, they did when we compared marketing spend to new and expansion ARR. These high-performers are ahead of the curve in how they think about marketing acquisition spend (i.e., on an LTV basis) and in ensuring that they are getting the most out of each customer.
High performers with ASPs over $25,000 saw their MQL to closed-won conversion rates grow more modestly but still increasing by 44% (note: again, not a conversion rate but an increase in conversion rate). These companies stepped up their efforts in getting more targeted content and messaging, increasing headcount in product marketing, brand, and content from 22% to 29% of total headcount. This investment paid off with their MQL to SQL conversion rate more than tripling and paired with a 37% drop in cost per marketing-sourced pipeline dollar. However, fighting budgetary constraints at enterprise buyers, they saw their SQL to closed-won conversion rates more than halved — in part due to sales cycles lengthening. Net-net though, they saw a drop in the amount of marketing dollars needed to generate a dollar in new business ARR, which was quite a feat given the challenges most companies faced.
High-performing companies stayed agile and shifted strategies to find new paths forward.
High-performing companies remained agile, testing new strategies and leaning into efficiencies. Those with ASP below $25,000 excelled by leaning into expansion and new go-to-market (GTM) strategies, increasing their expansion ARR as a percent of total new and expansion ARR to 67%, up from 50%. This focus was also reflected in an increase in their headcount focused on customer marketing, which climbed from 1% to 3%. They also explored GTM strategies more common for higher ASP companies, increasing partner and event headcount from 7% to 11%.
Meanwhile, high-performing companies with ASP above $25,000 focused on targeted, content-driven demand gen, maintaining a steady expansion rate of 34% and continuing to generate new ARR. They took a page from low-ASP companies, leaning into targeted and content-driven demand gen to drive new business. For these companies, demand generation headcount rose from 19% to 25% of total headcount (versus the drop we saw when we looked across all companies), and they also stepped up product marketing, brand, and content headcount to drive a more targeted and relevant buyer experience. As a percent of the overall headcount, these roles went up 7% versus the overall portfolio increase of 4%.
Looking forward: Our advice for 2024
For 2024, we expect companies to tackle these issues head-on. Over the past few years, the market has changed dramatically, and it will take a forward-looking organization to come out on top. We recommend a few focus areas to get ahead of the competition and evolve your marketing plan.
- Identify the root causes of funnel leakage to enhance conversion rates. This requires analyzing potential issues like poor targeting at the top of the funnel, gaps in lead management and qualification, SLA misalignment, and ensuring the presence of relevant content throughout the funnel. Marketing and sales should come together to identify issues and move away from finger-pointing.
- Strike a balance between expansion and the pursuit of new logos. Companies must shift their marketing efficiency analysis from new logos only to now include expansion. Even if marketing efforts mainly support new logo acquisition, generating customers in your ideal customer profile (ICP) with higher lifetime value allows for additional investment. We also believe marketing should become a lynchpin of expansion, collaborating cross-functionally with sales, customer success, and product teams to foster a cohesive strategy where campaigns and marketing support are tailored to bolster expansion efforts. The trend in efficiency over the past few years still exists but is not as prominent as companies have built expansion motions.
- Experiment with generative AI to help you do more with less. GenAI can amplify productivity and efficiency, enabling deeper market and customer insights. Start by identifying core use cases — content creation, competitor analysis, etc. — where it can have the biggest impact, and build up your tech stack with genAI capabilities.
- Get ahead of changes that may hinder your current strategies. Google’s Search Generative Experience (SGE), for example, will transform both paid and organic search. Now is also the time to start building a modern word-of-mouth strategy across communities, customers, and partners.
2023 presented a complex marketing landscape characterized by a slowdown in new business, cautious marketing spend, and a shift in resource allocation. Yet despite these challenges, companies demonstrated resilience by transitioning to newer strategies and pulling back spend from inefficient channels.
Success in 2024 will hinge on companies navigating the complexities of the current environment with agility and innovation, making informed strategic decisions to drive growth, and experimenting with genAI as it develops to stay ahead of technological shifts.