Scale up by the numbers: SaaS Sales KPIs from over 300 companies
Insight is excited to release the latest version of the SaaS Sales KPI Report. This data is self-reported from 300+ software companies that we have worked with in the past year, making this report truly one of the world’s most comprehensive and best sources of private SaaS sales KPI data. This report measures software sales operating performance by:
- ScaleUp company stage, represented by company size (2022 year-end ARR)
- Go-to-market motion: Transactional, solution, or consultative motions represented by average selling price (ASP)
While this report provides a point of reference for KPIs across various ScaleUp company stages and sales motions, we understand that every company is unique. These metrics should serve as guiding points through each section of your ScaleUp journey and help you understand where your performance lies in relation to that of your peers.
What’s in the report
The report covers five key areas and 19 individual metrics that are crucial for founders and leaders.
- Growth and profitability
- Sales efficiency
- Retention and churn
- Go-to-market strategy
- Sales productivity
Additional context and recent trends
Two key trends stand out as we look at this data over the past four years.
1. Growth rates were highest in 2021
After a brief slowdown in the first part of 2020, COVID-19 accelerated the value of software. Most companies saw new and expansion bookings growth rates increase in 2020 vs. 2019, as the sudden need to enable virtual work en masse catalyzed investments in digital transformation.
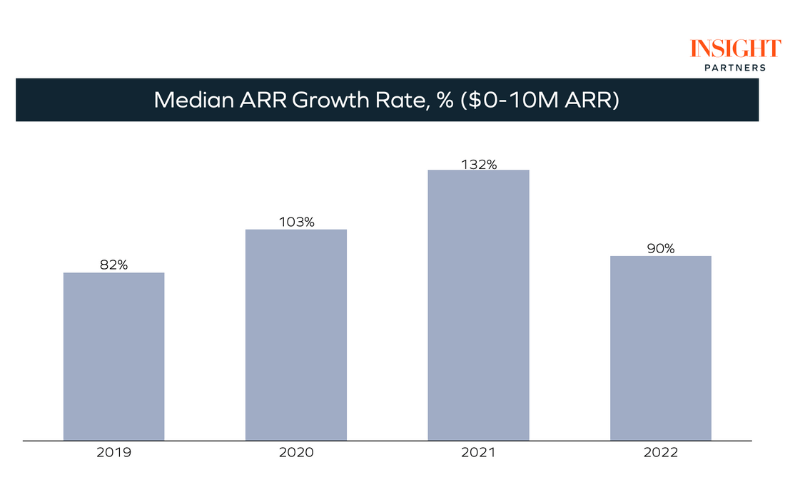
That trend continued into 2021, this time as both bookings growth rates and ARR growth rates increased compared to 2020. However, as the macro environment shifted in 2022, growth rates slowed and returned to 2020, and in some cases, 2019 levels. This trend is easily visualized when looking at the median ARR growth rates for companies between $0-10M of ARR over the past four years.
2. Sales and marketing costs outpaced revenue growth in 2021 and 2022
Year over year, in both 2021 and 2022, sales and marketing (S&M) as a percentage of revenue increased. In 2022, this increase was likely a result of:
- Companies increasing spending in anticipation of future growth in late 2021
- The subsequent slowing of growth in 2022 due to the macro environment
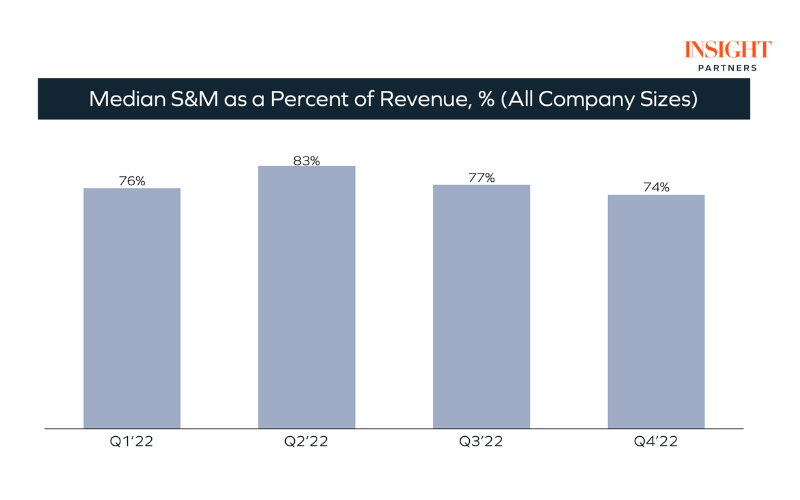
When we look at the data broken out quarterly we do see that in the second half of 2022, companies started to reduce their ratio of S&M expenses to revenue. For example, inclusive of companies of all sizes, in Q2 2022 we saw a median S&M as a percentage of revenue of 83%, with an eventual decline in Q3 and Q4. This trend becomes even more apparent when we disaggregate companies into their respective ARR groups (i.e., $0-10M ARR, $10-20M ARR, etc.) and take a more granular view. This indicates that companies started to right-size their spending in response to the macro environment shift in the first half of 2022.
Looking ahead into the second half of 2023
While the future of the broader economy in 2023 is uncertain, the trends of the past few quarters suggest that companies should be aware of their costs, efficiency, and productivity metrics as we move into a new post-COVID economic reality. Paying attention to the metrics highlighted in this report can help make sure you’re setting the foundation for your company to drive sustainable growth into the future.
For additional perspectives on which Sales KPIs to focus on by stage of company maturity, please read ScaleUp by the Numbers: SaaS Sales KPIs for Startups at Every Stage.